Sharpe, sortino, and calmar: A practical guide to risk-adjusted return metrics for crypto investors | AI generated image by XBTO
Sharpe, sortino, and calmar: A practical guide to risk-adjusted return metrics for crypto investors | AI generated image by XBTO
In our previous article, "The Quality of Returns," we explored why risk-adjusted performance matters in digital asset investing, and introduced the key metrics institutional allocators use to evaluate investment quality beyond headline returns. We established a core principle: a fund that delivers 70% returns with 80% drawdowns is not necessarily superior to one that compounds 30% with 15% drawdowns.
Building on that foundation, this article dives deeper into the practical application of risk-adjusted metrics. We'll examine how volatility, downside risk, and efficiency ratios reveal the true quality of returns, and demonstrate why strategies that prioritize consistency often outperform those chasing peaks.
Understanding Sharpe ratio Sortino ratio crypto evaluation is essential for evaluating crypto investments, comparing managers, and making informed allocation decisions. We'll define each metric in plain English, showing what "good" vs. "bad" values look like, demonstrate with real-world data from Bitcoin and XBTO's Trend strategy, and provide a practical framework for using these metrics in due diligence. By the end, you'll understand how institutional investors objectively compare crypto strategies - not by which gained the most, but by which gained most efficiently.
Why risk-adjusted metrics matter more than absolute returns
Absolute returns are seductive. A 100% gain sounds twice as good as a 50% gain. But this logic ignores a critical reality: investors must survive the journey to capture the destination.
A fund that delivers 100% returns with 90% drawdowns will lose most of its investors before they realize those gains. Redemptions, margin calls, or simple emotional exhaustion force exist at the worst possible time. A 73% loss needs +270% to break even; 15% needs only ~18%. Lower drawdowns mean faster recovery, which means more time compounding.
Risk committees impose volatility limits, drawdown thresholds, and risk budgets. A pension fund with a 25% volatility limit cannot hold an asset with 65% volatility, regardless of expected returns. A family office with a -30% drawdown threshold cannot endure -73% losses, regardless of eventual recovery.
Risk-adjusted metrics crypto frameworks translate these constraints into comparable numbers. They allow apples-to-apples comparison across strategies with different return and risk profiles. Think of institutional crypto metrics like fuel efficiency. Two cars might both reach the same destination, but one uses twice as much gas. The more efficient car is objectively better.
Similarly, two investments might deliver the same return, but one takes twice as much risk. The more efficient investment - higher return per unit of risk - is objectively better. This is what Sharpe ratio Sortino ratio crypto evaluation measures: efficiency. Return per unit of risk.
Each metric defines "risk" differently - total volatility, downside volatility, or maximum drawdown. Understanding these differences is key to using them effectively. Let's start with the most widely used: the Sharpe ratio.
Sharpe ratio: return per unit of total risk
The Sharpe ratio, developed by Nobel Prize-winning economist William Sharpe in 1966, measures return per unit of volatility.
The formula: (Return - risk-free rate) ÷ volatility (standard deviation of returns). In plain English: How much return did you earn for each unit of price fluctuation you endured?
Think of it like miles per gallon: how efficiently does a strategy convert risk (volatility) into return? This is the foundation of crypto Sharpe ratio calculation that institutions use globally. The Sharpe ratio is interpreted on a simple scale:
- Sharpe < 0: Strategy lost money or underperformed risk-free rate (bad)
- Sharpe 0-1: Strategy earned positive returns but inefficiently (acceptable)
- Sharpe 1-2: Good risk-adjusted returns (good)
- Sharpe 2-3: Very good risk-adjusted returns (very good)
- Sharpe > 3: Excellent risk-adjusted returns (excellent)
For context, the S&P 500's long-term Sharpe ratio is approximately 0.5-0.7. A hedge fund with a Sharpe above 1.5 is considered strong. This makes Bitcoin's recent performance particularly remarkable.
Bitcoin's Sharpe ratio has improved dramatically as volatility compresses and returns remain elevated. In 2025, Bitcoin's 12-month Sharpe ratio reached 2.42, placing it among the top 100 global assets by risk-adjusted returns. This is remarkable: Bitcoin outperforms large-cap tech stocks (which cluster around 1.0) and rivals gold's historical Sharpe ratio. For institutional allocators, this signals that Bitcoin's return potential now comes with more manageable risk - at least compared to its early years.
Let's walk through a crypto Sharpe ratio calculation example using Bitcoin's 2020-2025 data.
Bitcoin 2020-2025 Sharpe Calculation:
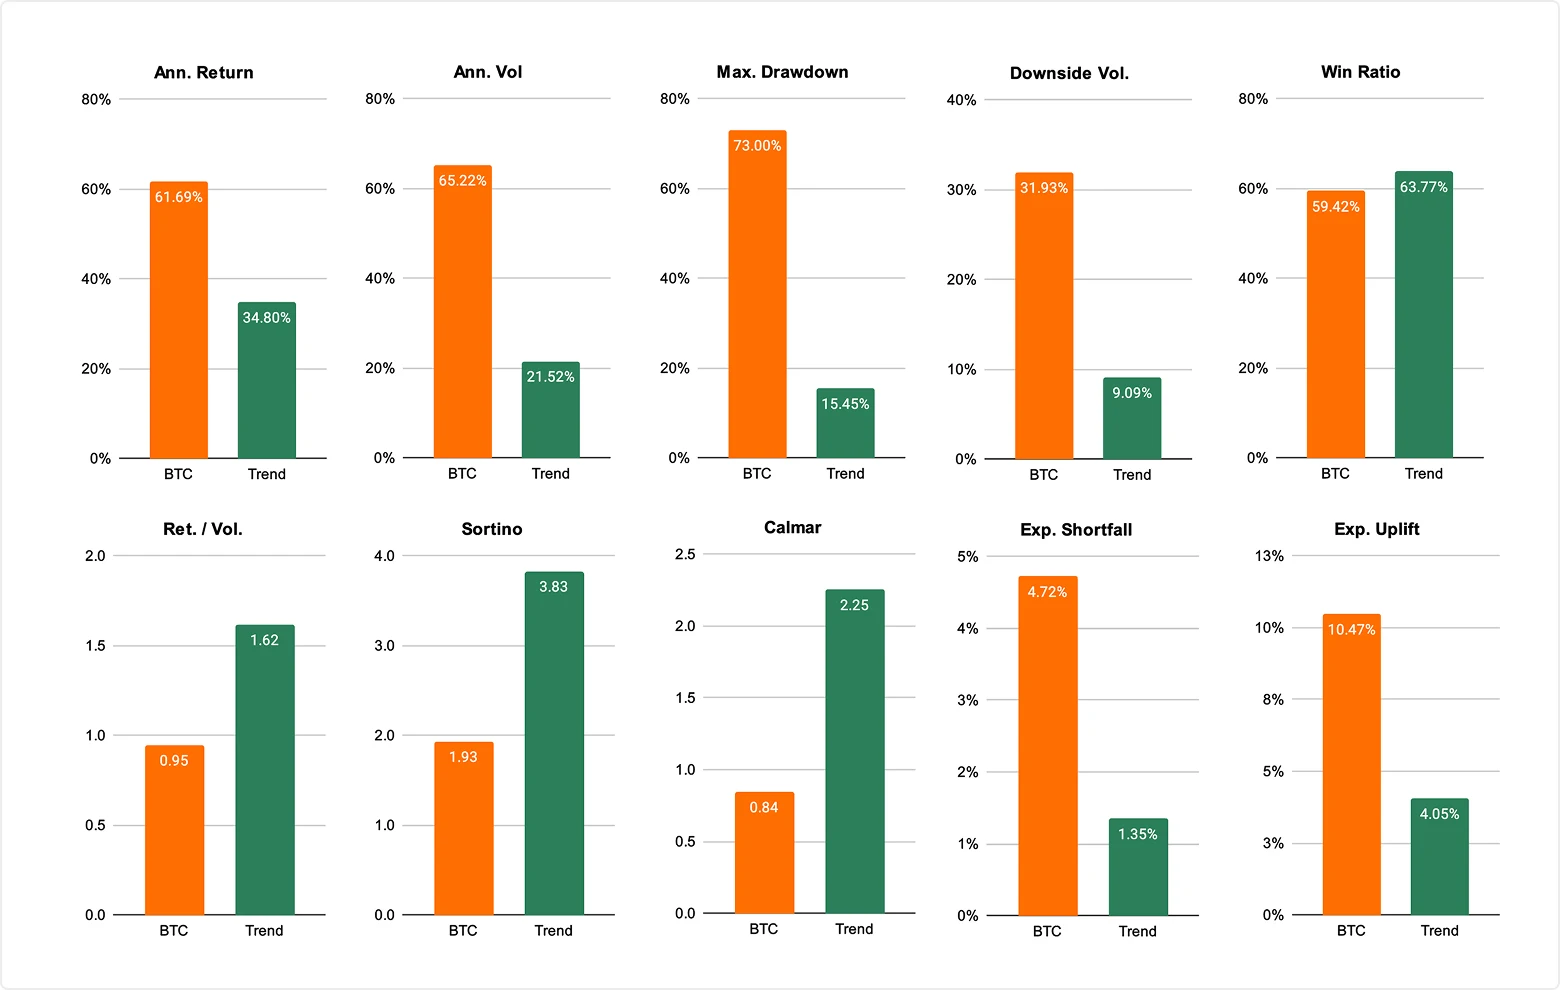
- Annualized return: 61.7%
- Risk-free rate (US 10-year): ~4%
- Volatility: 65.2%
- Sharpe = (61.7% - 4%) ÷ 65.2% = 0.88
Note: This is lower than the 2.42 cited for 2025 alone because that figure uses more recent data with compressed volatility (~40%). The formula is sensitive to the time period measured, highlighting why consistent measurement windows matter when comparing strategies.
However, the Sharpe ratio has a significant flaw: it treats upward volatility the same as downward volatility. It penalizes a strategy for big gains just as much as big losses. But for investors, upward volatility is desirable, not risky. You don't lose sleep when your portfolio jumps 20% in a month. You lose sleep when it drops 20%.
This is why many institutional investors prefer the Sortino ratio, which focuses only on downside risk - the volatility that actually matters.
Sortino ratio: return per unit of downside risk
The Sortino ratio, developed by Frank Sortino in the 1980s, improves on the Sharpe ratio by measuring return per unit of downside volatility only. The formula: (Return - target return) ÷ downside deviation (standard deviation of negative returns only). In plain English: How much return did you earn for each unit of harmful volatility (losses)?
The key insight: investors only care about downside volatility. Upward price movements aren't risky - they're desirable. By excluding upward volatility from the calculation, the Sortino ratio provides a more accurate picture of risk-adjusted performance. A strategy with a high Sortino ratio delivers returns while minimizing painful losses - exactly what risk-averse allocators want.
For crypto, where upside volatility can be extreme (Bitcoin's monthly gains have exceeded 40%), this distinction matters enormously. A strategy might have high total volatility (inflating its Sharpe ratio denominator) but low downside volatility (improving its Sortino ratio). This reveals that most volatility comes from gains, not losses.
Sortino ratios are generally higher than Sharpe ratios for the same strategy because the denominator (downside deviation) is smaller. As a rough guide for institutional crypto metrics:
- Sortino > 2.0: Good
- Sortino > 3.0: Very good
- Sortino > 4.0: Excellent
Many institutional investors set minimum Sortino thresholds (e.g., "we only invest in strategies with Sortino > 2.0") as part of their due diligence framework. This ensures that strategies aren't just delivering returns through excessive risk-taking.
Research from ARK Invest shows Bitcoin's Sortino ratio outperforms other asset classes by an average of +2.18 percentage points. This means Bitcoin's returns more than compensate for downside risk when upward volatility is excluded from the calculation.
In our Trend vs. passive Bitcoin comparison (2020-2025), the difference is stark:
- Passive Bitcoin: Sortino ratio 1.93 (good but not exceptional)
- XBTO Trend: Sortino ratio 3.83 (excellent - nearly 2x better)
This demonstrates how active management can improve downside-adjusted returns by reducing harmful volatility while maintaining upside participation. XBTO Trend achieved this through dynamic position sizing and regime-aware risk management - participating in uptrends while de-risking quickly when market conditions deteriorate.
When evaluating crypto managers, compare Sharpe ratio Sortino ratio crypto performance, not just one metric. A manager with Sharpe 1.5 and Sortino 3.0 is managing downside risk effectively. A manager with Sharpe 1.5 and Sortino 1.8 is experiencing symmetric volatility - both up and down. For risk-constrained allocators, the former is preferable: you're getting returns without the downside pain.
Calmar ratio: return per unit of maximum drawdown
The Calmar ratio, developed by Terry W. Young in 1991, measures annualized return divided by maximum drawdown. The formula: Annualized return ÷ maximum drawdown (largest peak-to-trough decline). In plain English: How much return did I earn for every percentage point of peak-to-trough loss I endured?
Maximum drawdown is arguably the single most important risk metric for institutional investors because it represents the worst-case pain. It's not about average volatility or typical fluctuations. It's about the deepest valley you had to traverse - the moment of maximum fear and uncertainty.
For many investors, maximum drawdown determines survivability. A -30% drawdown is uncomfortable but manageable. A -73% drawdown triggers redemptions, margin calls, and forced liquidations. The Calmar ratio Bitcoin metric reveals whether returns justified that pain. Calmar ratios vary widely by asset class and strategy:
- Calmar < 0.5: Poor (returns don't justify drawdowns)
- Calmar 0.5-1.0: Acceptable
- Calmar 1.0-2.0: Good
- Calmar > 2.0: Excellent
For context, a balanced 60/40 portfolio typically has a Calmar ratio around 0.8-1.2. This provides a useful benchmark when evaluating crypto strategies. Passive Bitcoin's Calmar ratio over 2020-2025 was approximately 0.84:
- Annualized return: 61.7%
- Maximum drawdown: -73%
- Calmar = 61.7 ÷ 73 = 0.84
This is acceptable but not exceptional. The high returns are offset by the brutal drawdown. An investor who bought Bitcoin at its November 2021 peak ($69,000) endured a decline to $15,000 by November 2022 - a loss that would test even the most committed holder. By contrast, XBTO Trend achieved a Calmar ratio Bitcoin performance of 2.25:
- Annualized return: 34.8%
- Maximum drawdown: -15.5%
- Calmar = 34.8 ÷ 15.5 = 2.25
This is nearly 3x better than passive Bitcoin. The trade-off: concede ~27% of annualized return, but reduce maximum drawdown by nearly 5x. For institutional allocators, this trade-off is often worth it. A 15.5% drawdown is survivable; a 73% drawdown is not.
The recovery math illustrates why this matters. As XBTO's research demonstrates: "A 73% loss needs +270% to break even; 15% needs only ~18%." Lower drawdowns mean faster recovery, which means more time compounding. Strategies with high Calmar ratio Bitcoin values spend less time recovering and more time growing.
This is the essence of risk-adjusted metrics crypto evaluation: not just how high returns climbed, but how smooth the path was along the way. The Calmar ratio captures this trade-off perfectly.
Real-world application: comparing two crypto strategies
To see how these institutional crypto metrics work together, let's compare two hypothetical crypto strategies using the Fund A vs. Fund B example from the introduction. Both delivered strong absolute returns, but their risk-adjusted profiles are radically different.
At first glance, Fund A appears spectacular - more than doubling Fund B's return. Yet its risk profile tells a different story. Fund A's 70% gain was achieved with 100% volatility and drawdowns as deep as 80%. Its Sharpe (0.7), Sortino (1.2), and Calmar (0.9) ratios are all mediocre.
Fund B's 30% return may seem pedestrian, but it was achieved with 15% volatility and contained drawdowns. Its Sharpe (2.0), Sortino (3.8), and Calmar (2.0) ratios are all excellent. The verdict: Fund B delivers returns more efficiently. It earns 2-3x more return per unit of risk taken.
Fund A made money, but not efficiently. Its results were impressive in outcome yet fragile in structure. For institutional allocators, Fund B wins easily. It fits within risk budgets, survives governance scrutiny, and allows investors to stay invested through volatility. Fund A might look better in hindsight, but few investors would have survived the 80% drawdown to capture those returns.
How to use these metrics in portfolio allocation decisions
Understanding Sharpe ratio Sortino ratio crypto performance is only valuable if you know how to apply it. Here's a practical framework for using risk-adjusted metrics crypto in allocation decisions:
A simple rule of thumb for institutional crypto metrics: Prioritize strategies with Sharpe > 1.0, Sortino > 2.0, and Calmar > 1.0. These thresholds ensure you're being adequately compensated for the risks you're taking.
Beyond the numbers: understanding the "why" behind performance
When evaluating managers, don't just look at risk-adjusted metrics and crypto values. Ask: Does the manager understand why their strategy performs the way it does?
Can they explain negative months? Do losses align with the strategy's design? Or are they surprised by their own results?
Risk-adjusted metrics reveal whether a strategy's behavior aligns with its intent. A trend-following strategy should have high win ratio and positive skewness (many small wins, few large losses). If it doesn't, something is wrong. A market-neutral strategy should have low beta and low correlation to Bitcoin. If it doesn't, it's not actually market-neutral. Metrics expose misalignment between stated strategy and actual behavior.
When evaluating crypto managers using institutional crypto metrics, ask these questions:
- What are your Sharpe, Sortino, and Calmar ratios over 1, 3, and 5 years?
- How do they compare to passive Bitcoin and peer strategies?
- Can you explain periods when your ratios deteriorated? What caused it?
- What risk controls ensure your metrics remain stable across market regimes?
Understanding Sharpe ratio Sortino ratio crypto performance isn't just about numbers - it's about understanding the quality of returns and the discipline behind them.
The language of professional crypto investment
Risk-adjusted metrics crypto frameworks - Sharpe, Sortino, and Calmar ratios - reveal what absolute returns hide: the efficiency, consistency, and survivability of investment strategies. They answer the question that matters most: not just how much was earned, but how well it was earned.
When evaluating crypto investments, don't stop at absolute returns. Demand Sharpe, Sortino, and Calmar ratios. Compare them to benchmarks and peers using these institutional crypto metrics standards. Look for strategies that deliver Sharpe > 1.0, Sortino > 2.0, and Calmar > 1.0 - thresholds that ensure you're being adequately compensated for risk.
And most importantly, choose strategies you can actually stay invested in. Because survivability is the precondition for compounding.
Download XBTO's comprehensive guide: "The Quality of Returns: A Practical Guide to Understanding Risk Metrics in Investing" for deeper insights into risk-adjusted performance. Explore XBTO's Trend strategy: See how active management delivers superior Sortino (3.83) and Calmar (2.25) ratios compared to passive Bitcoin.
In crypto, as in all investing, the quality of returns matters as much as the quantity.
Collapse
The full breakdown
In our first article, "Navigating Crypto Volatility: The Advantages of Active Management," we explored how the high volatility and low correlation of digital assets with traditional asset classes create unique opportunities for active managers. We discussed how these characteristics enable active managers to execute tactical trading strategies, capitalizing on short-term price movements and market inefficiencies. Building on that foundation, we now turn our attention to the unique market microstructure of digital assets.
Conducive market microstructure of digital assets
The market microstructure of digital assets - a framework that defines how crypto trades are conducted, including order execution, price formation, and market interactions - sets the stage for active management to thrive. This unique ecosystem, characterized by its continuous trading hours, diverse trading venues, and substantial market liquidity, offers several advantages for active management, providing a fertile ground for sophisticated investment strategies.
24/7/365 market access
One of the defining characteristics of digital asset markets is their continuous, round-the-clock operation.
Unlike traditional financial markets that operate within specific hours, cryptocurrency markets are open 24 hours a day, seven days a week, all year round. This continuous trading capability is particularly advantageous for active managers for several reasons:
- Immediate response to market events: Unlike traditional markets that close after regular trading hours, digital asset markets allow managers to react immediately to breaking news or events that could impact asset prices. For instance, if a significant economic policy change occurs over the weekend, managers can adjust their positions in real-time without waiting for markets to open.
- Managing volatility: Continuous trading provides more opportunities to capitalize on price movements and volatility. Active managers can take advantage of this by implementing strategies such as short-term trading or hedging to mitigate risks and lock in gains whenever market conditions change. For instance, if there’s a sudden drop in the price of Bitcoin, managers can quickly sell their holdings to minimize losses or buy in to capitalize on the lower prices.
Variety of trading venues
The proliferation and variety of trading venues is another crucial element of the digital asset market structure. The extensive landscape of over 200 centralized exchanges (CEX) and more than 500 decentralized exchanges (DEX) offers a wide array of platforms for cryptocurrency trading. This diversity is beneficial for active managers in several ways:
- Risk management and diversification: By spreading trades across various exchanges, active managers can mitigate counterparty risk associated with any single platform. Additionally, the ability to trade on both CEX and DEX platforms allows managers to diversify their strategies, incorporating different levels of decentralization, regulatory environments, and security features.
- Arbitrage opportunities: Different venues often exhibit price discrepancies, presenting arbitrage opportunities. For example, managers can buy an asset on one exchange at a lower price and sell it on another where the price is higher, thus generating risk-free profits.
- Access to diverse liquidity pools: Multiple trading venues provide access to diverse liquidity pools, ensuring that managers can execute large trades without significantly impacting the market price.
Spot and derivatives markets (Variety of instruments)
The seamless integration of spot and derivatives markets within the digital asset space presents a considerable advantage for active managers. With substantial liquidity in both markets, they can implement sophisticated trading strategies and manage risk more effectively.
For instance, as of August 8 2024, Bitcoin (BTC) boasts a daily spot trading volume of $40.44 billion and an open interest in futures of $27.75 billion. Additionally, derivatives such as futures, options, and perpetual contracts enable managers to hedge positions, leverage trades, and employ complex strategies that can amplify returns.

Overall, the benefits for active managers include:
- Hedging and risk management: Derivatives offer a powerful tool for hedging against unfavorable price movements, enabling more efficient risk management. For instance, a manager holding a substantial amount of Bitcoin in the spot market can use Bitcoin futures contracts to safeguard against potential price drops, thereby enhancing risk control.
- Access to leverage: Managers can use derivatives to leverage their positions, amplifying potential returns while maintaining control over risk exposure. For instance, by employing options, a manager can gain exposure to an underlying asset with only a fraction of the capital needed for a direct spot purchase, thereby enabling more capital-efficient investment strategies.
- Strategic flexibility: By integrating spot and derivatives markets, managers can implement sophisticated strategies designed to capitalize on diverse market conditions. For instance, they may engage in volatility selling, where options are sold to generate income from market volatility, regardless of price direction. Additionally, managers can leverage favorable funding rates in perpetual futures markets to enhance yield generation. Basis trading, another strategy, involves taking offsetting positions in spot and futures markets to profit from price differentials, enabling returns that are independent of market movements.
Exploiting market inefficiencies
Digital asset markets, being relatively nascent, are less efficient compared to traditional financial markets. These inefficiencies arise from various factors, including regulatory differences, market segmentation, and varying levels of market maturity. For example:
- Pricing anomalies: Phenomena like the "Kimchi premium," where cryptocurrency prices in South Korea trade at a premium compared to other markets, create arbitrage opportunities. Managers can exploit these by buying assets in one market and selling them in another at a higher price.
- Exploiting mispricings: Active managers can identify and capitalize on mispricings caused by market inefficiencies, using strategies such as statistical arbitrage and mean reversion.
The unique aspects of the digital asset market structure create an exceptionally conducive environment for active management. Continuous trading hours and diverse venues provide the flexibility to react quickly to market changes, ensuring timely execution of trades. The availability of both spot and derivatives markets supports a wide range of sophisticated trading strategies, from hedging to leveraging positions. Market inefficiencies and pricing anomalies offer numerous opportunities for generating alpha, making active management particularly effective in the digital asset space. Furthermore, the ability to hedge and manage risk through derivatives, along with exploiting uncorrelated performance, enhances portfolio resilience and stability.
In our next article, we'll delve into the various techniques active managers employ in the digital asset markets, showcasing real-world use cases.
Read full disclaimer