

The quality of returns: Crypto risk-adjusted performance | AI generated image by XBTO
The quality of returns: Crypto risk-adjusted performance | AI generated image by XBTO
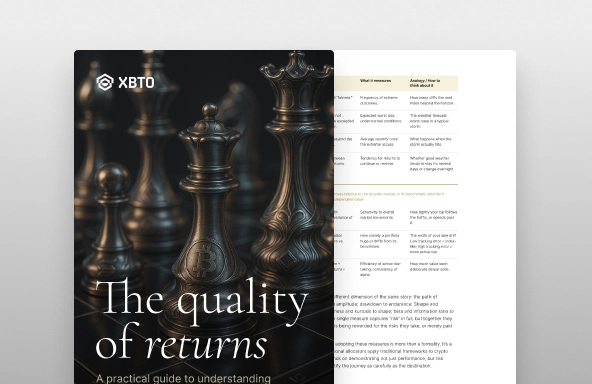
Two crypto funds. Fund A returned 70% last year with 80% drawdowns. Fund B returned 30% with 15% drawdowns. Which is better?
For institutional investors, the answer isn't as obvious as it seems. The question is no longer how high returns can go, but how steady the path can be on the way there.
Because investors do not compound returns they cannot stay invested in.
This is the essence of crypto risk-adjusted returns: understanding not just how much was earned, but how much uncertainty, volatility, and potential loss were endured to earn it. As institutional capital enters crypto-pension funds, endowments, family offices-performance must be judged not just by what was earned, but by what was risked to earn it. Traditional finance has long prioritized risk-adjusted returns. Pension funds, endowments, and sovereign wealth investors all allocate capital through frameworks that weigh returns against risk budgets, volatility limits, and drawdown tolerances.
In 2025, as Bitcoin's volatility compresses (declining from 200% in 2012 to 50% today) and institutional infrastructure matures, crypto is finally ready for this framework. Bitcoin's 2025 Bitcoin Sharpe ratio reached 2.42, placing it among the top 100 global assets by risk-adjusted returns.
This article explores why risk-adjusted returns matter, introduces the key metrics institutional allocators use (Sharpe, Sortino, Calmar ratios), and demonstrates how active management can improve survivability and compounding in institutional crypto allocation.
The path matters as much as the destination
In investing, it's tempting to focus on the finish line: the headline return, the percentage gain, the chart that slopes up and to the right. Yet too often, that singular focus blinds investors to the most important question of all: what did it take to get there?
A strategy that doubles capital in a year but suffers 80% drawdowns along the way may look impressive on paper, but few investors will survive the emotional and fiduciary turbulence required to fully capture it. This is the true cost of carry: the emotional burden of enduring risk. For many, it becomes too heavy to bear, forcing them to leave the party early, never to return, or worse, to rejoin just as the next correction begins.
Whether institutional or retail, investors share one universal temptation: to focus on the outcome, not the process.
Consider the arithmetic of losses. Lose 50%, and you need 100% to recover. Lose 80%, and you need 400%. Every large drawdown doesn't just reduce wealth: it resets the compounding base. A strategy that avoids deep losses, even at the cost of slightly lower returns, often ends up ahead over time.
For institutional allocators, this isn't just theory. Risk budgets, volatility limits, and drawdown tolerances are hard constraints. A pension fund with a 25% volatility limit cannot hold an asset with 65% volatility, regardless of returns. A family office with a -30% drawdown threshold cannot endure -73% losses, regardless of eventual recovery. This is why institutional investors prioritize crypto risk-adjusted returns: they describe not only how much a portfolio moves, but how it feels to hold it. So how do we measure this? How do we quantify the difference between a smooth path and a chaotic one? That's where risk-adjusted metrics come in.
Why traditional investors measure risk-adjusted returns
In traditional finance, risk-adjusted performance crypto evaluation is second nature. Pension funds, endowments, and sovereign wealth investors all allocate capital through frameworks that weigh returns against risk budgets, volatility limits, and drawdown tolerances. These aren't arbitrary constraints. They reflect fiduciary duty, governance processes, and the reality that large institutions cannot exit positions quickly during stress.
A risk budget is the total amount of risk an institution is willing to take across its entire portfolio. If a pension fund allocates 5% to crypto, that 5% might consume 20-30% of the total portfolio risk budget due to crypto's high volatility. This forces a trade-off: higher crypto allocation means lower allocation to other risk assets.
But institutions aren't the only ones constrained. Retail investors face an even less predictable constraint: emotion. Behavioral biases-fear, overconfidence, loss aversion-often turn volatility into poor decision-making. This is the true cost of carry: the emotional burden of enduring risk.
Studies show that most retail investors who bought Bitcoin at the 2021 peak ($69,000) sold during the 2022 trough ($15,000), locking in 78% losses. They missed the 2023-2024 recovery not because the asset failed, but because they couldn't endure the journey.
The difference between a trader and a professional manager lies not in making money when prices rise, but in preserving it when they fall." Professional managers use risk-adjusted metrics not to eliminate risk, but to measure, manage, and harness it as a source of opportunity. That discipline-knowing when and why a strategy performs-is what separates skill from luck.
The key metrics institutional allocators use
Risk-adjusted metrics translate uncertainty into understanding. They reveal not just how much was earned, but how well it was earned along the way. Here are the three core efficiency metrics institutional allocators use to evaluate crypto investments.
The Bitcoin Sharpe ratio measures return per unit of volatility. It's calculated as (Return - risk-free rate) ÷ volatility. Think of it like miles per gallon: how efficiently does a strategy convert risk into return? A Sharpe ratio above 1.0 is considered good; above 2.0 is very good; above 3.0 is excellent. Bitcoin's Sharpe ratio has improved dramatically as volatility compresses. In 2025, Bitcoin's 12-month Sharpe ratio reached 2.42, placing it among the top 100 global assets by risk-adjusted returns. This outperforms large-cap tech stocks (which cluster around 1.0) and rivals gold's historical Sharpe ratio. For context, the S&P 500's long-term Sharpe ratio is approximately 0.5-0.7. However, the Sharpe ratio has a flaw: it penalizes upward volatility just as much as downward volatility. For investors, only downside volatility matters. That's where the Sortino ratio comes in.
The Sortino ratio improves on the Sharpe ratio by measuring return per unit of downside volatility only. It's calculated as (Return - target) ÷ downside volatility, where downside volatility measures only negative returns. For institutional investors, this is a more meaningful metric because upward volatility is desirable, not risky. A strategy with high Sortino ratio delivers returns while minimizing painful losses-exactly what risk-averse allocators want.
In the XBTO Trend vs. passive Bitcoin comparison, XBTO Trend achieved a Sortino ratio of 3.83 compared to Bitcoin's 1.93-representing a 2x improvement in downside risk efficiency. This means Trend's returns more than compensate for downside risk when upward volatility is excluded from the calculation.
The Calmar ratio measures annualized return divided by maximum drawdown. It answers the question: how much return did I earn for every percentage point of peak-to-trough loss I endured?
Maximum drawdown is the single most important risk metric for many institutional investors because it represents the worst-case pain. A high Calmar ratio means strong returns without catastrophic losses-the holy grail of institutional investing. Passive Bitcoin's Calmar ratio over 2020-2025 was approximately 0.84, reflecting 61.7% annualized returns against a 73% maximum drawdown. By contrast, actively managed strategies can achieve Calmar ratios above 2.0 by reducing drawdowns while maintaining solid returns. This brings us to the critical question: can active management improve these metrics?
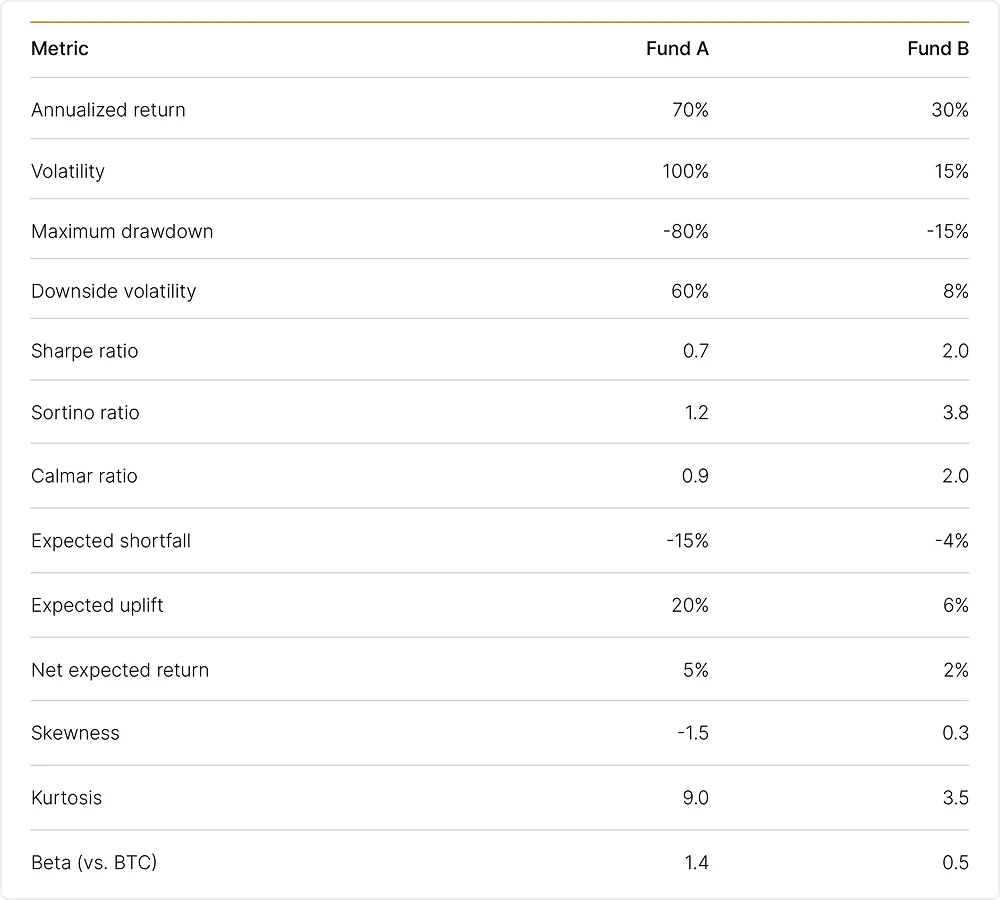
On paper, Fund A’s returns look spectacular (i.e., 70% p.a.), but they came with 100% volatility and drawdowns of 80%. Few investors would endure that ride. Fund B’s 30% annualized return looks modest in comparison, yet it was delivered with steady control: low volatility, shallow drawdowns, and a far smoother path. In digital assets, that principle is amplified. A 50% drawdown requires a 100% recovery to break even. An 80% loss demands a 400% rebound. The math of recovery is unforgiving, and it is why allocators focus less on the highest peaks and more on the stability of the climb.
Case study: active management vs. passive Bitcoin exposure
To illustrate how risk-adjusted metrics work in practice, let's compare passive Bitcoin exposure with active management. We'll use data from XBTO's Trend strategy-a long/short trend-following approach-versus passive Bitcoin over the period January 2020 to September 2025. This timeframe spans multiple market regimes: the 2020-2021 bull run, the 2022 bear market, and the 2023-2025 recovery.
Max. drawdown: Active vs. Passive
.webp)
%20(1).webp)
Collapse
The full breakdown
In our first article, "Navigating Crypto Volatility: The Advantages of Active Management," we explored how the high volatility and low correlation of digital assets with traditional asset classes create unique opportunities for active managers. We discussed how these characteristics enable active managers to execute tactical trading strategies, capitalizing on short-term price movements and market inefficiencies. Building on that foundation, we now turn our attention to the unique market microstructure of digital assets.
Conducive market microstructure of digital assets
The market microstructure of digital assets - a framework that defines how crypto trades are conducted, including order execution, price formation, and market interactions - sets the stage for active management to thrive. This unique ecosystem, characterized by its continuous trading hours, diverse trading venues, and substantial market liquidity, offers several advantages for active management, providing a fertile ground for sophisticated investment strategies.
24/7/365 market access
One of the defining characteristics of digital asset markets is their continuous, round-the-clock operation.
Unlike traditional financial markets that operate within specific hours, cryptocurrency markets are open 24 hours a day, seven days a week, all year round. This continuous trading capability is particularly advantageous for active managers for several reasons:
- Immediate response to market events: Unlike traditional markets that close after regular trading hours, digital asset markets allow managers to react immediately to breaking news or events that could impact asset prices. For instance, if a significant economic policy change occurs over the weekend, managers can adjust their positions in real-time without waiting for markets to open.
- Managing volatility: Continuous trading provides more opportunities to capitalize on price movements and volatility. Active managers can take advantage of this by implementing strategies such as short-term trading or hedging to mitigate risks and lock in gains whenever market conditions change. For instance, if there’s a sudden drop in the price of Bitcoin, managers can quickly sell their holdings to minimize losses or buy in to capitalize on the lower prices.
Variety of trading venues
The proliferation and variety of trading venues is another crucial element of the digital asset market structure. The extensive landscape of over 200 centralized exchanges (CEX) and more than 500 decentralized exchanges (DEX) offers a wide array of platforms for cryptocurrency trading. This diversity is beneficial for active managers in several ways:
- Risk management and diversification: By spreading trades across various exchanges, active managers can mitigate counterparty risk associated with any single platform. Additionally, the ability to trade on both CEX and DEX platforms allows managers to diversify their strategies, incorporating different levels of decentralization, regulatory environments, and security features.
- Arbitrage opportunities: Different venues often exhibit price discrepancies, presenting arbitrage opportunities. For example, managers can buy an asset on one exchange at a lower price and sell it on another where the price is higher, thus generating risk-free profits.
- Access to diverse liquidity pools: Multiple trading venues provide access to diverse liquidity pools, ensuring that managers can execute large trades without significantly impacting the market price.
Spot and derivatives markets (Variety of instruments)
The seamless integration of spot and derivatives markets within the digital asset space presents a considerable advantage for active managers. With substantial liquidity in both markets, they can implement sophisticated trading strategies and manage risk more effectively.
For instance, as of August 8 2024, Bitcoin (BTC) boasts a daily spot trading volume of $40.44 billion and an open interest in futures of $27.75 billion. Additionally, derivatives such as futures, options, and perpetual contracts enable managers to hedge positions, leverage trades, and employ complex strategies that can amplify returns.

Overall, the benefits for active managers include:
- Hedging and risk management: Derivatives offer a powerful tool for hedging against unfavorable price movements, enabling more efficient risk management. For instance, a manager holding a substantial amount of Bitcoin in the spot market can use Bitcoin futures contracts to safeguard against potential price drops, thereby enhancing risk control.
- Access to leverage: Managers can use derivatives to leverage their positions, amplifying potential returns while maintaining control over risk exposure. For instance, by employing options, a manager can gain exposure to an underlying asset with only a fraction of the capital needed for a direct spot purchase, thereby enabling more capital-efficient investment strategies.
- Strategic flexibility: By integrating spot and derivatives markets, managers can implement sophisticated strategies designed to capitalize on diverse market conditions. For instance, they may engage in volatility selling, where options are sold to generate income from market volatility, regardless of price direction. Additionally, managers can leverage favorable funding rates in perpetual futures markets to enhance yield generation. Basis trading, another strategy, involves taking offsetting positions in spot and futures markets to profit from price differentials, enabling returns that are independent of market movements.
Exploiting market inefficiencies
Digital asset markets, being relatively nascent, are less efficient compared to traditional financial markets. These inefficiencies arise from various factors, including regulatory differences, market segmentation, and varying levels of market maturity. For example:
- Pricing anomalies: Phenomena like the "Kimchi premium," where cryptocurrency prices in South Korea trade at a premium compared to other markets, create arbitrage opportunities. Managers can exploit these by buying assets in one market and selling them in another at a higher price.
- Exploiting mispricings: Active managers can identify and capitalize on mispricings caused by market inefficiencies, using strategies such as statistical arbitrage and mean reversion.
The unique aspects of the digital asset market structure create an exceptionally conducive environment for active management. Continuous trading hours and diverse venues provide the flexibility to react quickly to market changes, ensuring timely execution of trades. The availability of both spot and derivatives markets supports a wide range of sophisticated trading strategies, from hedging to leveraging positions. Market inefficiencies and pricing anomalies offer numerous opportunities for generating alpha, making active management particularly effective in the digital asset space. Furthermore, the ability to hedge and manage risk through derivatives, along with exploiting uncorrelated performance, enhances portfolio resilience and stability.
In our next article, we'll delve into the various techniques active managers employ in the digital asset markets, showcasing real-world use cases.
Read full disclaimer


Bitcoin vs Ethereum: Institutional allocation strategy in 2026
Bitcoin vs Ethereum: Institutional allocation strategy in 2026
Knowledge
February 3, 2026

Bitcoin vs Ethereum: Institutional allocation strategy in 2026

Crypto portfolio allocation 2026: Institutional strategy guide
Crypto portfolio allocation 2026: Institutional strategy guide
Knowledge
February 3, 2026
Crypto portfolio allocation 2026: Institutional strategy guide


Custody powered by

The financial products and services are not available in the United States and generally available only to qualified participants (, as defined by Bermuda law) and professional clients (as defined by FSRA Conduct of Business Rulebook). Additional restrictions may apply. This website contains trademarks of XBTO Beehive, LLC. All rights reserved.
Bermuda · Miami · New York · London · Paris · Abu Dhabi
Download the XBTO/Stablehouse mobile app:


