
The BTC floor held. Now the institutional thesis builds. | AI generated image by XBTO

BTC absorbed a geopolitical shock, held its floor, and recovered through April. The correlation, the dominance data, and the on-chain structure now point in the same direction, and institutional allocators are starting to notice.
The month in brief
April's price action was straightforward on the surface: the partial Iran ceasefire removed the geopolitical risk premium that had compressed markets since February, and virtually every major asset class recovered. BTC rose +11.81%. But the Nasdaq gained +15.29%, and oil surged +15.59%. In a risk-on month driven by a single macro catalyst, BTC was not the top performer, it was the median one.
During the preceding stress period, BTC held while equities fell. In April, everything recovered and BTC participated but did not lead. Taken together, the two periods define a market that is neither decoupling nor behaving as pure risk-on beta, and understanding what sits between those two states is the analytical task this month.
Monthly asset returns - April 2026 (%)

Month-to-date returns for selected crypto and traditional assets as of 30 Apr 2026. Crypto sourced from Binance (USDT pairs, monthly close). Traditional assets from Yahoo Finance (monthly close, price return only); oil proxied by USO ETF.
Have we entered Bitcoin season? We explore this through four lenses:
BTC Dominance (%) (right axis) vs. ETH/BTC ratio (left axis), Nov 2020-Apri 2026
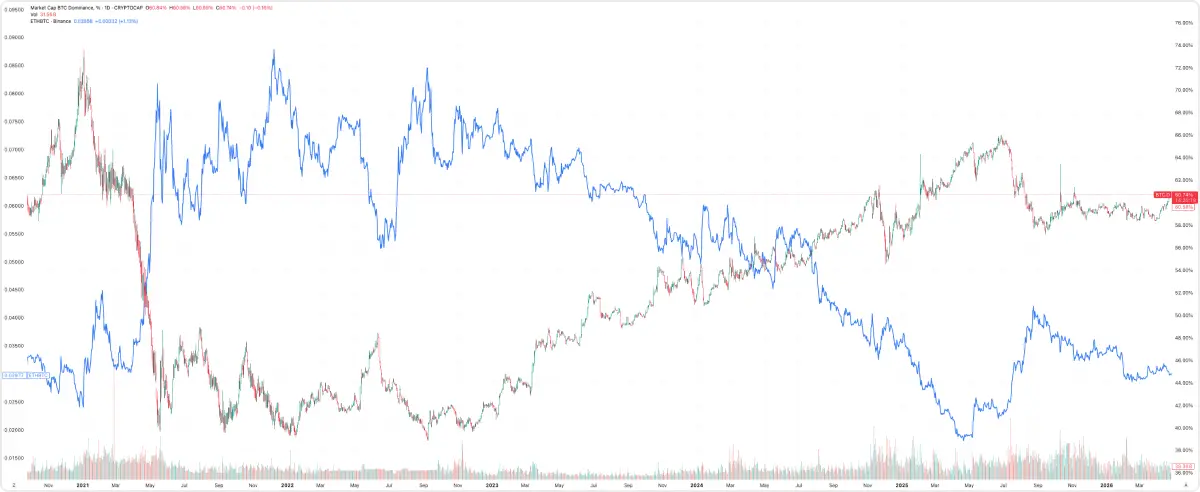
Source: TradingView
BTC dominance is recovering toward its highest sustained level since early 2021, closing April at approximately 60%, while the ETH/BTC ratio stands at 0.03.1 The Altcoin Season Index closed the month at 38/100.2 This is structurally consistent with an early-to-mid institutional adoption cycle: new capital defaults to the most liquid, most ETF-accessible asset. The $102 billion in BTC ETF AUM versus $13 billion in ETH reflects this preference directly.
The institutional dynamic reinforces the picture. Institutional capital, now anchored in spot Bitcoin ETFs, is less likely to rotate into altcoins than retail capital was in the prior cycle. In 2021, BTC dominance declining from 70% preceded a broad altcoin rally driven by retail momentum. In 2026, with ETF infrastructure concentrating flows into BTC specifically, that automatic rotation mechanism is structurally weaker.
BTC vs. Nasdaq 100: 12-month rolling correlation

12-month rolling Pearson correlation between BTC monthly returns and Nasdaq 100 monthly returns. A correlation above 0.5 indicates BTC is trading with high-beta tech characteristics. A sustained move below 0.5 supports the thesis that BTC is maturing as a distinct asset class. Current reading: +0.68 (Apr 2026).
The 12-month rolling BTC/Nasdaq correlation closed April at +0.68, back in high positive territory after the brief dip during the conflict escalation. A single period of divergence followed by a month where the correlation re-asserted on a shared catalyst does not constitute a regime shift. What April clarifies is the baseline: BTC, at its current stage of institutional adoption, still travels with risk assets more often than it diverges. The more useful framing is conditional, BTC appears to diverge positively when stress is driven by fiat debasement or geopolitical inflation risk, and re-couples when the catalyst is pure sentiment reversal. If that pattern holds, it defines a specific portfolio role: not a permanent low-correlation asset, but a regime-conditional hedge.
Our analysis of BTC across 15 macro shocks since 2015 shows that Bitcoin's response to geopolitical stress has been nuanced, but over longer horizons it has tended to stabilize or outperform when the shock feeds into inflation, energy markets, or broader macro dislocation. Read the full report here.
Global M2 (USD trillions) (left axis) vs BTC price (right axis), Jul 2020–Jul 2026, with 10-week lead applied to M2
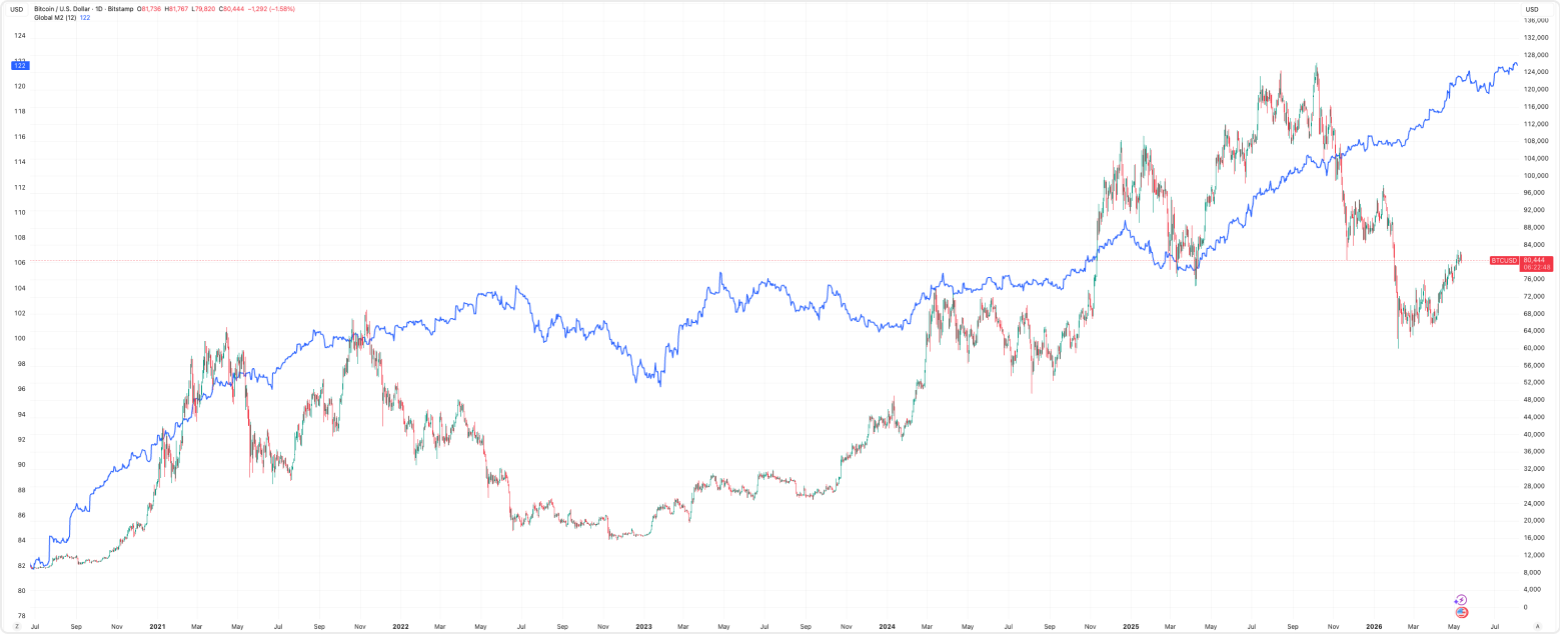
Source: TradingView
The U.S. money supply has grown by a trillion dollars in seven months from July 2025 to February 2026, rising above $20.4 trillion, with eight of the last twelve months posting increases, including substantial growth in November, December 2025 and February 2026. The global M2 of the 21 major central banks, shifted 10 weeks relative to BTC price, has historically been a reliable leading indicator of BTC's performance. With the Fed's quantitative tightening programme having ended in December 2025, the liquidity environment entering Q2 2026 is the most expansionary it has been since 2022, the last time global M2 growth preceded a major BTC rally.
This matters for BTC because its price has historically tracked global M2 more closely than it has tracked the Fed funds rate. When more money enters the global financial system, a portion finds its way into hard and scarce assets. With its fixed supply, BTC is a direct beneficiary of that dynamic, with its fixed supply. The Fed's reluctance to cut does not neutralise this: monetary policy sets the rate, but fiscal spending drives the aggregate money supply, and the two have been pulling in opposite directions since late 2025. If the historical 10-week lag holds, the liquidity expansion already underway should translate into BTC price support through Q2; a tailwind that the ceasefire recovery has partially obscured but not invalidated.
ETF flows – reversed at scale, but composition matters. U.S. spot Bitcoin ETFs recorded $1.97 billion in net inflows during April, the strongest monthly total of 2026, surpassing March's $1.37 billion.3 Total AUM crossed $102 billion, with cumulative lifetime inflows at $58.5 billion. IBIT alone drew approximately $2 billion, accounting for roughly 70% of all April inflows; a concentration that raises a structural question about the breadth of the demand recovery.4 Mid-August Q2 13F filings will provide the cleaner read on whether new institutional entrants drove April's inflows, or whether they represent concentrated catch-up from existing large allocators.
Spot Bitcoin ETF monthly net inflows, Jan 2025–Apr 2026 (USD billions)
Source: Coinglass
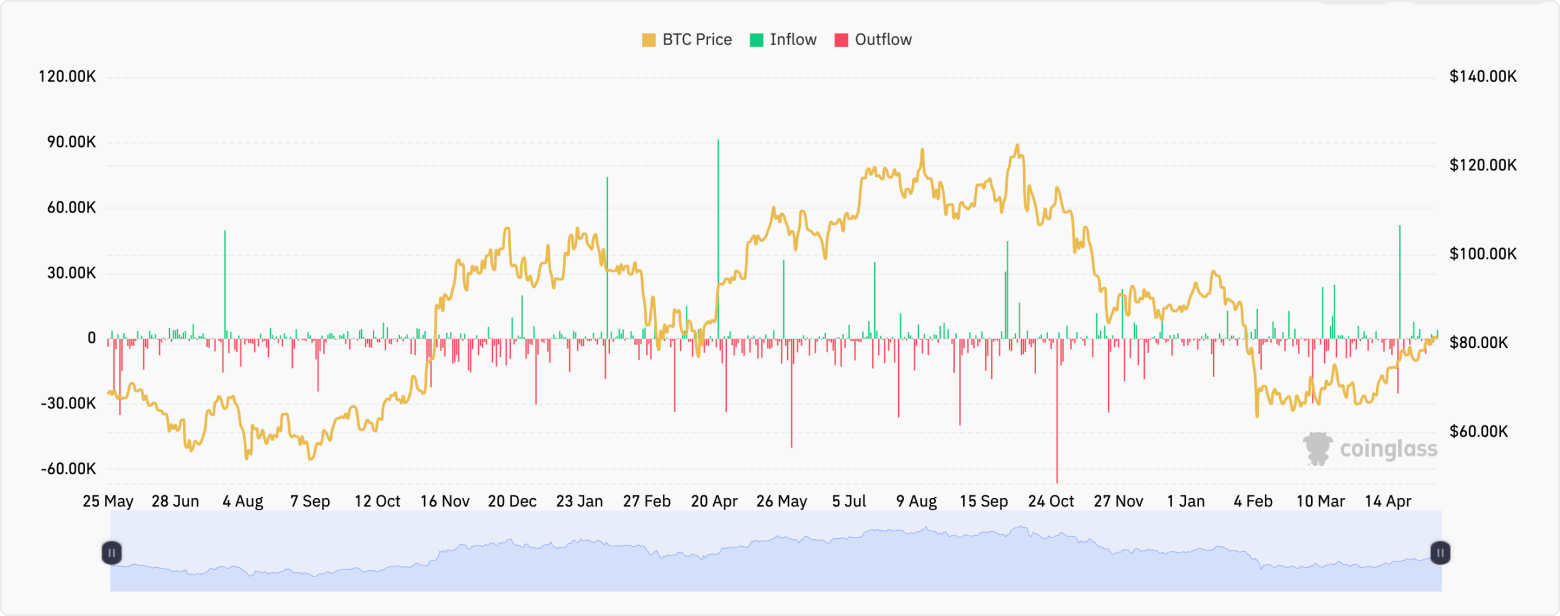
Exchange reserves – at seven year lows. Bitcoin exchange reserves stand at approximately 2.4 million BTC, continuing a multi-year structural decline.5 Coins are migrating to cold storage, ETF custodians, and corporate treasuries. This reduction in the liquid, tradable float means that even moderate sustained demand produces disproportionate price impact, a supply dynamic that operates independently of macro conditions and compounds the bull case when demand inflects.
MVRV-Z Scores – still in accumulation territory. The MVRV Z-score measures whether BTC is over or undervalued relative to what holders collectively paid for it. At 0.74, the average holder closed April near or below breakeven, which has historically marked the early stages of recovery cycles rather than distribution tops. Every prior instance of MVRV recovering from below 1.0 has produced positive 12-month forward returns. With seven occurrences since 2013, the sample size is limited, but the consistency makes it a signal worth tracking.
Bitcoin: MVRV Z-Score
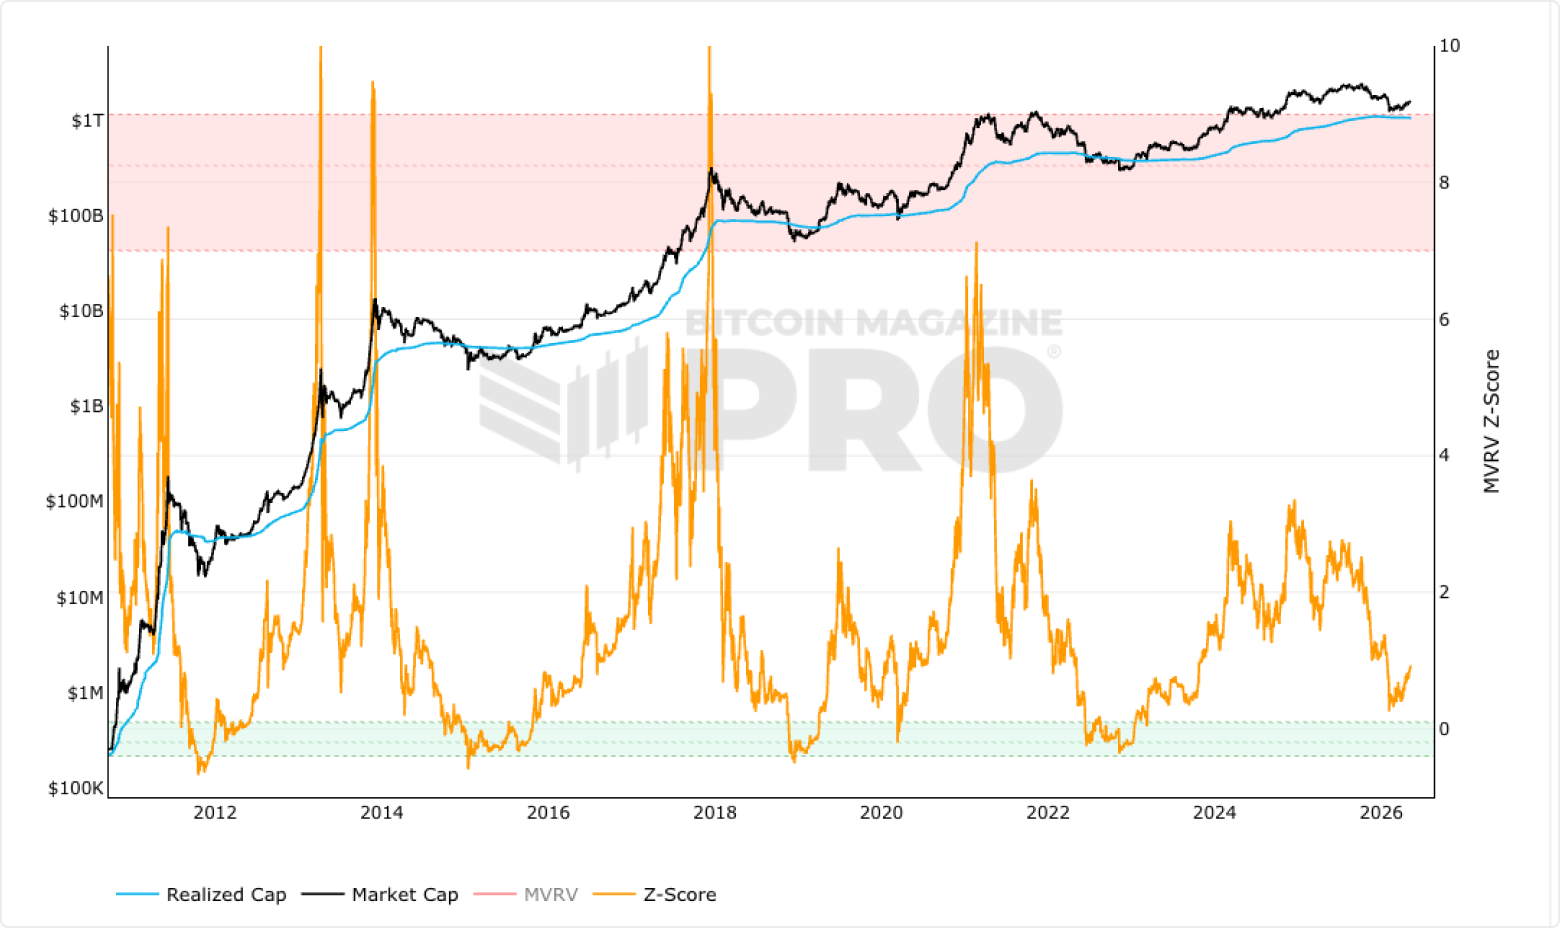
Source: Bitcoin Magazine
LTH Supply – held through the full stress period. Approximately 16 million BTC remains held by long-term holders (wallets unmoved for 155+ days), representing roughly 73% of circulating supply.6 This metric held flat through the entire February–April period: six months that included the oil shock, four consecutive months of ETF outflows, and 46 days of Extreme Fear sentiment. The absence of distribution from long-term holders during sustained stress is a reliable structural signal.
Fear & Greed – sentiment lagging price. The Fear & Greed Index closed April at 29 (Fear) despite BTC’s +11.81% monthly gain, before recovering towards Neutral in early May. In genuine recovery regimes, sentiment historically lags price by weeks. That lag is consistent with the accumulation picture the structural signals are painting.
Crypto Fear & Greed Index, trailing 12 months (daily)

Composite sentiment index aggregating volatility, market momentum, social media activity, BTC dominance, and Google Trends. Scale 0 = Extreme Fear, 100 = Extreme Greed. April close: 29 (Fear). Monthly average 22.8. (Source: Alternative.me)
The critical pushback – the rally's engine was futures, not spot. CryptoQuant's apparent demand metric shows that April's price recovery was driven by expanding perpetual futures activity while spot Bitcoin demand contracted throughout the move.7 When price rises on leverage rather than direct coin accumulation, the uptrend is more vulnerable, futures positions can unwind quickly, and without a spot bid to absorb that selling, corrections can be sharp. This does not invalidate the structural accumulation picture, but it is a meaningful caution: the floor may be solid, while the rally above it remains contingent on spot demand stepping in to confirm the move.
Macro & on-chain synthesis
The structural case is the strongest it has been since Q4 2025. Dominance broke out, on-chain accumulation held through six months of stress, and global liquidity is expanding with a historical lag that points to Q2 support. These are not sentiment signals, they are structural conditions that have preceded sustained BTC-led advances in prior cycles.
What is missing is confirmation on two fronts. First, the macro unlock: rate expectations have not shifted, the Fed's internal posture has moved toward higher-for-longer, and the ceiling that capped Q1 remains in place. Second, on-chain validation: April's rally was seemingly driven by futures positioning rather than spot accumulation, meaning the move needs spot demand to step in before it can be considered structurally supported rather than leverage-dependent. The forward signal to watch is whether BTC holds as equities face headwinds from the Fed posture. A sustained divergence across two to three months would upgrade the regime assessment materially.
The one structural caution is demand concentration. IBIT accounted for roughly 70% of April's ETF inflows, and Strategy holds over 4% of circulating supply. Strip out those two structural bids, and the breadth of institutional demand looks thinner than the headline numbers imply. This is not a near-term risk, but it is a variable to watch as the institutional adoption story broadens.
Portfolio perspective
BTC dominance strengthening, MVRV in the accumulation zone, and exchange reserves at seven-year lows collectively define a structural entry setup that does not appear often. The question for institutional allocators is not whether to have a view; it is how to size it.
For an interactive view of how different BTC allocations affect portfolio risk, return, and drawdown profiles across a five-year horizon, including pure BTC and actively managed strategies:
Our monthly call
Regime: Bitcoin season prevailing. The rally needs on-chain confirmation.
The floor held. The thesis is intact. What converts this from a base-building phase into a sustained advance is a macro unlock: a shift in rate expectations that removes the ceiling, combined with spot demand stepping in to validate the futures-led April move. Until either of these happen, BTC is well-positioned but range-bound by forces outside the on-chain picture.
Top conviction signal: LTH supply unmoved through six months of geopolitical shock, ETF outflows, and 46 days of Extreme Fear. Conviction buyers did not flinch. That is the floor.
Watching in May
- Fed Chair transition: Powell’s term expires May 15, and Warsh's first communication as Fed Chair may be the most consequential macro variable for Q2
- BTC/Nasdaq correlation: a renewed decline from +0.68 while equities face headwinds would be the clearest regime upgrade signal
- BTC dominance direction: a hold above 60% builds the case
- Spot demand recovery: whether on-chain spot activity steps in to validate the futures-led April move
- ETF flow composition: does April momentum hold without a geopolitical catalyst?
- CLARITY Act: Senate floor vote timing remains the key near-term regulatory catalyst
Collapse
The full breakdown
In our first article, "Navigating Crypto Volatility: The Advantages of Active Management," we explored how the high volatility and low correlation of digital assets with traditional asset classes create unique opportunities for active managers. We discussed how these characteristics enable active managers to execute tactical trading strategies, capitalizing on short-term price movements and market inefficiencies. Building on that foundation, we now turn our attention to the unique market microstructure of digital assets.
Conducive market microstructure of digital assets
The market microstructure of digital assets - a framework that defines how crypto trades are conducted, including order execution, price formation, and market interactions - sets the stage for active management to thrive. This unique ecosystem, characterized by its continuous trading hours, diverse trading venues, and substantial market liquidity, offers several advantages for active management, providing a fertile ground for sophisticated investment strategies.
24/7/365 market access
One of the defining characteristics of digital asset markets is their continuous, round-the-clock operation.
Unlike traditional financial markets that operate within specific hours, cryptocurrency markets are open 24 hours a day, seven days a week, all year round. This continuous trading capability is particularly advantageous for active managers for several reasons:
- Immediate response to market events: Unlike traditional markets that close after regular trading hours, digital asset markets allow managers to react immediately to breaking news or events that could impact asset prices. For instance, if a significant economic policy change occurs over the weekend, managers can adjust their positions in real-time without waiting for markets to open.
- Managing volatility: Continuous trading provides more opportunities to capitalize on price movements and volatility. Active managers can take advantage of this by implementing strategies such as short-term trading or hedging to mitigate risks and lock in gains whenever market conditions change. For instance, if there’s a sudden drop in the price of Bitcoin, managers can quickly sell their holdings to minimize losses or buy in to capitalize on the lower prices.
Variety of trading venues
The proliferation and variety of trading venues is another crucial element of the digital asset market structure. The extensive landscape of over 200 centralized exchanges (CEX) and more than 500 decentralized exchanges (DEX) offers a wide array of platforms for cryptocurrency trading. This diversity is beneficial for active managers in several ways:
- Risk management and diversification: By spreading trades across various exchanges, active managers can mitigate counterparty risk associated with any single platform. Additionally, the ability to trade on both CEX and DEX platforms allows managers to diversify their strategies, incorporating different levels of decentralization, regulatory environments, and security features.
- Arbitrage opportunities: Different venues often exhibit price discrepancies, presenting arbitrage opportunities. For example, managers can buy an asset on one exchange at a lower price and sell it on another where the price is higher, thus generating risk-free profits.
- Access to diverse liquidity pools: Multiple trading venues provide access to diverse liquidity pools, ensuring that managers can execute large trades without significantly impacting the market price.
Spot and derivatives markets (Variety of instruments)
The seamless integration of spot and derivatives markets within the digital asset space presents a considerable advantage for active managers. With substantial liquidity in both markets, they can implement sophisticated trading strategies and manage risk more effectively.
For instance, as of August 8 2024, Bitcoin (BTC) boasts a daily spot trading volume of $40.44 billion and an open interest in futures of $27.75 billion. Additionally, derivatives such as futures, options, and perpetual contracts enable managers to hedge positions, leverage trades, and employ complex strategies that can amplify returns.

Overall, the benefits for active managers include:
- Hedging and risk management: Derivatives offer a powerful tool for hedging against unfavorable price movements, enabling more efficient risk management. For instance, a manager holding a substantial amount of Bitcoin in the spot market can use Bitcoin futures contracts to safeguard against potential price drops, thereby enhancing risk control.
- Access to leverage: Managers can use derivatives to leverage their positions, amplifying potential returns while maintaining control over risk exposure. For instance, by employing options, a manager can gain exposure to an underlying asset with only a fraction of the capital needed for a direct spot purchase, thereby enabling more capital-efficient investment strategies.
- Strategic flexibility: By integrating spot and derivatives markets, managers can implement sophisticated strategies designed to capitalize on diverse market conditions. For instance, they may engage in volatility selling, where options are sold to generate income from market volatility, regardless of price direction. Additionally, managers can leverage favorable funding rates in perpetual futures markets to enhance yield generation. Basis trading, another strategy, involves taking offsetting positions in spot and futures markets to profit from price differentials, enabling returns that are independent of market movements.
Exploiting market inefficiencies
Digital asset markets, being relatively nascent, are less efficient compared to traditional financial markets. These inefficiencies arise from various factors, including regulatory differences, market segmentation, and varying levels of market maturity. For example:
- Pricing anomalies: Phenomena like the "Kimchi premium," where cryptocurrency prices in South Korea trade at a premium compared to other markets, create arbitrage opportunities. Managers can exploit these by buying assets in one market and selling them in another at a higher price.
- Exploiting mispricings: Active managers can identify and capitalize on mispricings caused by market inefficiencies, using strategies such as statistical arbitrage and mean reversion.
The unique aspects of the digital asset market structure create an exceptionally conducive environment for active management. Continuous trading hours and diverse venues provide the flexibility to react quickly to market changes, ensuring timely execution of trades. The availability of both spot and derivatives markets supports a wide range of sophisticated trading strategies, from hedging to leveraging positions. Market inefficiencies and pricing anomalies offer numerous opportunities for generating alpha, making active management particularly effective in the digital asset space. Furthermore, the ability to hedge and manage risk through derivatives, along with exploiting uncorrelated performance, enhances portfolio resilience and stability.
In our next article, we'll delve into the various techniques active managers employ in the digital asset markets, showcasing real-world use cases.
Read full disclaimer