

The buyer of last resort blinks | AI generated image by XBTO

Bitcoin had its worst month since June 2022. Equities, riding a year of double-digit gains, barely noticed, and gold fell right alongside crypto. Strategy’s Board turned last month’s one-off Bitcoin sale into standing policy, signaling how far the pressure on Bitcoin's largest structural holders has spread.
The month in brief
June was a sharp selloff for the hard-asset trade. BTC fell from roughly $73,700 to a year-to-date low near $58,100, down 20.43% on the month, with ETH, XRP, and SOL close behind at 21.67%, 21.97%, and 10.64% respectively. Gold, the other asset most often pitched as an inflation hedge, fell 11.68% over the same stretch, and oil gave back 17.55% of its earlier war-driven spike. The dollar index rose 2.31%, and that's the cleanest signal of what actually happened: capital rotated toward the dollar and away from every hard-asset hedge, crypto included.
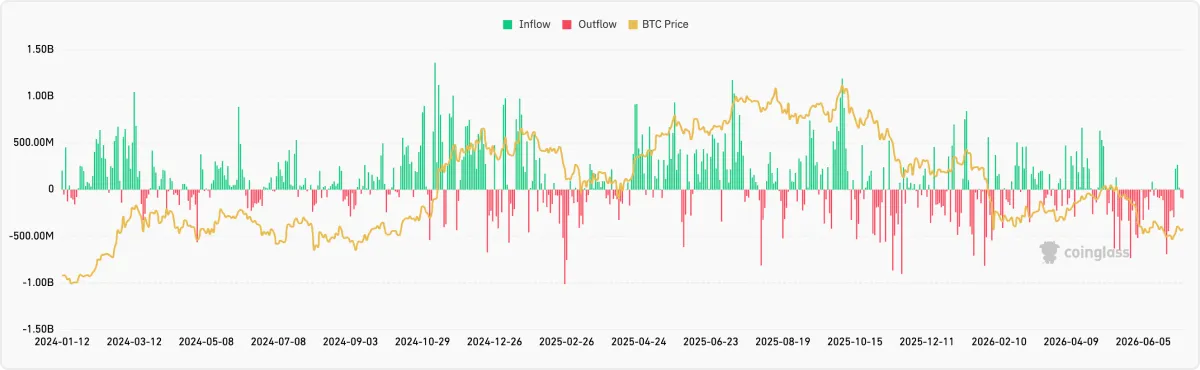
The institutional data confirms the price action rather than just tracking it. US spot Bitcoin ETFs recorded $4.06 billion in net outflows in June, the worst month since the category launched in January 2024, making 2026 the first calendar year on record with negative cumulative flows.
Monthly asset returns - June 2026 (%)
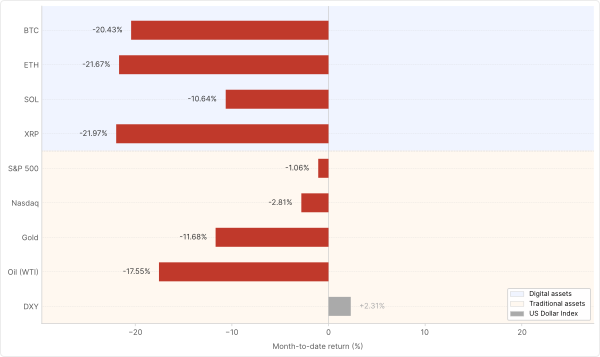
Month-to-date returns for selected crypto and traditional assets as of 30 June 2026. Crypto sourced from Binance (USDT pairs, monthly close). Traditional assets from Yahoo Finance (monthly close, price return only); oil proxied by USO ETF.
Equities told a different story entirely, and for the second month running. The S&P 500 slipped just 1.06% off a fresh record, and the Nasdaq's 2.81% dip still closed out its best quarter in six years, both shallow pullbacks in a year the S&P is up roughly 9.5%. BTC has now underperformed equities for two consecutive months, and June's decline was sharper than May's, which argues against reading this as a temporary timing gap waiting on a single catalyst. Bitcoin's largest corporate holder added to that pressure rather than absorbing it, which is the story the rest of this month’s issue is built around.
The structural story: Strategy breaks the doctrine
Strategy's investment thesis for four years has rested on one sentence: buy and never sell. That changed in June. The company's Board formalized what had looked like an isolated event last month, authorizing a BTC Monetization Program of up to $1.25 billion in Bitcoin sales going forward, framed by CEO Phong Le as selling opportunistically rather than only to cover a fixed obligation.1 Under that new authority, the company sold 3,588 BTC for $216 million to fund a preferred-stock dividend, trimming the treasury to 843,775 BTC.2 It was Strategy's largest Bitcoin sale to date this cycle, well above the 32 BTC sale disclosed in late May.
The numbers behind the decision are as important as the decision itself. Per Strategy's own Q2 filing, the company posted an $8.32 billion loss on digital assets for the quarter, and as of June 30 the cost basis of its Bitcoin holdings exceeded their fair value, meaning the largest corporate Bitcoin holder in the world is, on average, underwater on its entire stack. The dividend obligation driving the sale comes from Strategy's preferred stock structure, which carries an 11.5% dividend and has to be paid in dollars, not Bitcoin.
Analyst reaction has split cleanly among a familiar line. Bernstein described Strategy as unlikely to face forced selling, estimating 17 months of cash coverage for dividend obligations, and continued to characterize the company as a net buyer and a balancing force in a market where Bitcoin miners have also shifted toward selling as they pivot capacity toward AI infrastructure.3 The counter-read is structural rather than immediate: a treasury that sells under any condition is a different instrument than one that only buys, and the market has spent four years pricing Strategy as the latter.
Why this matters beyond one company
Strategy's accumulation has been one of the more persistent, price-insensitive sources of Bitcoin demand since 2020. A framework that formalizes selling, even selling described as small relative to daily BTC volume, changes the shape of that demand curve at the margin, and it does so at the exact moment ETF flows turned negative for the year. Gold, the other major structural hedge, is also down double digits from its highs. Whether June's sale is a one-off adjustment to a specific dividend structure or the first crack in a multi-year demand pillar is the open question for the next two to three months, and it's a cleaner test than most: either the $1.25 billion authorization gets used again, or it doesn't.
Strategy's decision to become an opportunistic seller didn't happen in a vacuum. The Fed didn't just fail to hand Bitcoin a catalyst in June, it removed the one assumption BTC had been trading on all year. Real yields rose, the rate-cut consensus reversed into hike odds, and Bitcoin's classification as a risk asset reasserted itself at the exact moment its own institutional demand was already thinning. Three signals tell that story with precision:
1. The Fed turned genuinely hawkish, not just cautious
New Chair Kevin Warsh's first meeting on June 17 held rates at 3.50% to 3.75% as expected, but the substance sat in what changed around the decision. The Committee substantially shortened its policy statement and removed language implying its next move would likely be a rate cut, effectively eliminating forward guidance. Warsh declined to submit his own dot-plot projection of future rates, calling the exercise unhelpful to policy conduct, and told reporters the committee was "unanimous and unambiguous" on fighting inflation, repeating "price stability" a dozen times in the press conference. By July 1, he was telling markets directly that "prices are too high."The Fed's updated projections raised the 2026 inflation outlook to 3.6% headline and 3.3% core, up from 2.7% for both in March. This isn't a data-dependent pause. It's a Fed that stopped promising to look through supply-driven inflation and started treating it as a reason to hold tight for longer, a harder ceiling for risk assets to price around.
2. Real yields rose alongside Bitcoin's decline
The rise in real yields has reversed the relationship that had defined the year so far. The 10-year TIPS yield closed June at 2.20%, up from 2.06% in May, with Treasury yields surging specifically on June 17 as the Fed dropped its easing bias. The 12-month rolling correlation between BTC and real yield changes fell to +0.13 from +0.24 the month before, continuing a decline from the +0.57 to +0.60 range seen earlier in the year. For most of 2026, Bitcoin had been trading with a positive correlation to real yields, rising alongside them in a way that looked more like a debasement hedge than a rate-sensitive risk asset. June broke that pattern: real yields rose and Bitcoin fell, the more conventional, pre-2024 relationship reasserting itself. One month isn't enough to call this a durable regime shift, but it's the most direct rebuttal yet to the idea that Bitcoin has structurally decoupled from rate expectations.
BTC vs 10Y real yields: 12-month rolling correlation
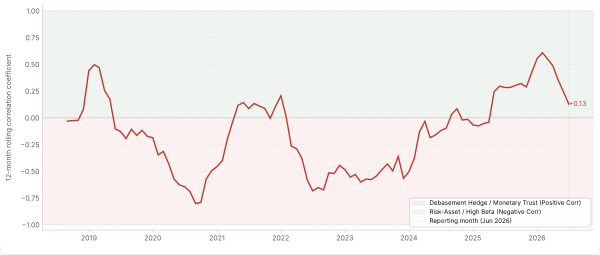
12-month rolling Pearson correlation between BTC monthly returns and monthly changes in the 10Y TIPS real yield (FRED: DFII10). Positive zone = BTC behaving as a debasement hedge. Negative zone = BTC behaving as a rate-sensitive risk asset. Current reading: +0.13 (June 2026). Source: FRED (DFII10), Binance (BTC/USDT monthly close).
3. Equities absorbed the same shock without much damage
The S&P's 1.06% dip and the Nasdaq's 2.81% pullback happened inside a quarter that was otherwise the Nasdaq's best in six years, powered by an AI capital expenditure cycle that kept earnings beats coming through the same month rates repriced higher. That's a market with an earnings and narrative cushion large enough to absorb a hawkish surprise. Bitcoin has no equivalent cushion right now. It entered June already down sharply from its 2025 high, with ETF demand already fading and its largest corporate holder already under balance-sheet pressure. The same rate shock landed on two assets in very different starting positions, and the size of the reaction says more about that starting position than about the shock itself. This is the signal that matters most for the decoupling debate: if BTC and equities were responding to the same macro inputs with similar sensitivity, June should have hurt both. It didn't.
The 12-month rolling correlation between BTC and the Nasdaq 100 sits at +0.55, essentially unchanged from May's +0.57 and still firmly in the territory that classifies BTC as a risk asset moving broadly with equities. That classification cuts both ways this month: it means institutional allocators with risk-asset frameworks had no structural reason to rotate into BTC as a hedge when equities wobbled, but it also means BTC's underperformance wasn't a correlation breakdown, it was a much larger reaction within an unchanged relationship. Two consecutive months near +0.55 to +0.57 mean that reclassification, whenever it comes, is not yet underway.
BTC vs Nasdaq 100: 12-month rolling correlation (monthly data, since 2015)
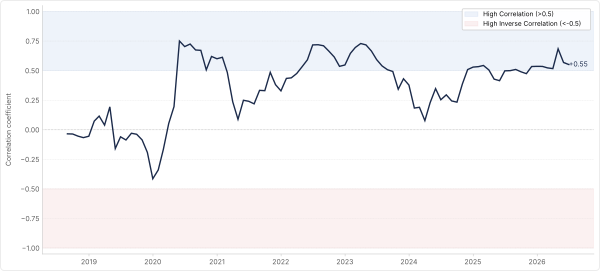
12-month rolling Pearson correlation between BTC monthly returns and Nasdaq 100 monthly returns. A correlation above 0.5 indicates BTC is trading with high-beta tech characteristics. A sustained move below 0.5 supports the thesis that BTC is maturing as a distinct asset class. Current reading: +0.55 (June 2026). Source: Binance (BTC/USDT monthly close), Yahoo Finance (^NDX monthly close)
The on-chain picture this month reads more like a market stalling under macro pressure than one capitulating outright. Here's what the data shows at month-end:
MVRV Z-Score - a dip and a partial recovery. The Z-score fell to 0.18 at the June close, its lowest reading since January 2023, before recovering to 0.30 by early July. That round trip puts it in a similar range to March's accumulation-zone reading, but the trajectory matters more than the level: a metric that dipped and is already recovering reads differently than one still falling.
BTC vs Nasdaq 100: 12-month rolling correlation (monthly data, since 2015)
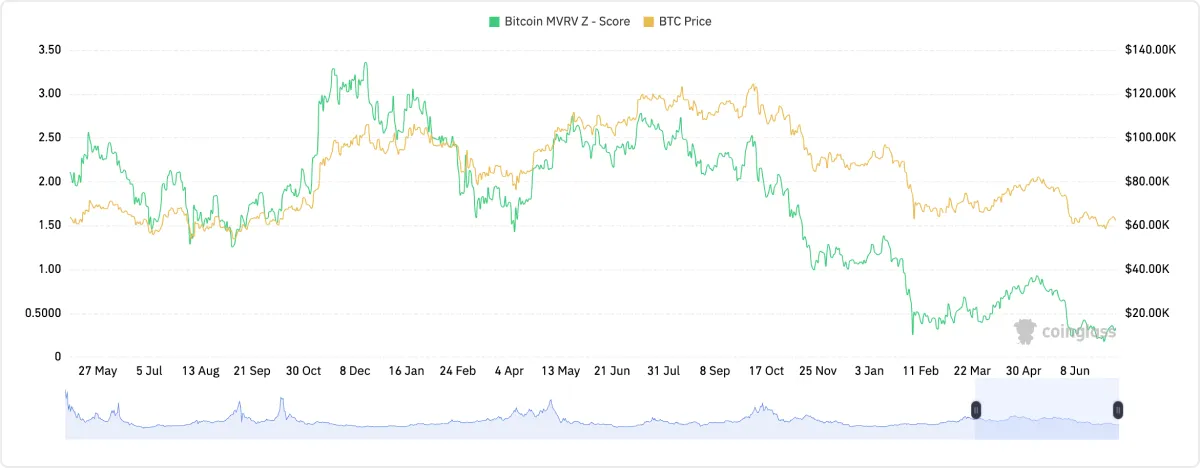
Source: CoinGlass
Exchange reserves - unchanged, which is itself information. Reserves sit at 2.48 million BTC, flat against May's reading. Neither meaningful accumulation nor meaningful distribution is showing up here, which is consistent with a market that's stalled rather than moving decisively in either direction.
Long-term holder supply - still climbing, still not the bullish signal it looks like. LTH supply reached 16.63 million BTC at the end of June, up from 16.3 million in May. CryptoQuant's own research pushes back on the obvious read, arguing the increase reflects the absence of new buyers rather than genuine accumulation, since LTH supply grows mechanically whenever coins age in place without changing hands and a meaningful share of the STH decline is just old exchange-held coins aging into long-term status, not new demand absorbing them. The relevant question is whether new demand is entering to absorb what's being held, and the metric that looked bullish in March and April is, this month, closer to evidence of a stalled market than a convinced one.
LTH-SOPR and STH-SOPR - telling two different stories. The SOPR metric tracks whether long-term and short-term holders are selling at a profit (above 1.0) or a loss (below 1.0). LTH-SOPR dipped below 1.0 in June and has oscillated between 0.8 and 1.0 into early July, long-term holders realizing losses. STH-SOPR has stayed near 1.0, short-term holders roughly breaking even rather than capitulating. In May, both cohorts broke below 1.0 together, the simultaneous-capitulation pattern that has historically marked major lows. This month, only the long-term cohort is underwater, a narrower, more contained form of stress than May's.
Realized losses - no capitulation spike yet. Sellers realized roughly 187,000 BTC of losses over the past 30 days, well below the 400,000 BTC realized in February 2026 and the 1.2 million BTC realized at the November 2022 FTX-collapse bottom.8 Historically, that kind of forced, indiscriminate loss-taking has marked selling exhaustion. Its absence here means one of two things: either the current price level is closer to a floor than the price action suggests, or the market hasn't finished clearing and there's another leg of realized losses still to come.
BTC dominance - contraction, not rotation. BTC dominance sits at 57.90%. Altcoins fell in similar or greater proportion to BTC this month, so the roughly flat dominance reading confirms capital is leaving crypto broadly rather than rotating within it, the same read as May. Sustained dominance below 55% alongside altcoin price appreciation would be the signal that changes this read.
Fear & Greed Index - 15 Extreme Fear, tracking price - The Fear & Greed Index plunged to 11 on June 3 as BTC traded near $65,853, and fell again to 15 by late June. Unlike March, when Extreme Fear sat alongside a holding price and looked like a lagging, contrarian signal, this month sentiment and price have moved together. That's the more ordinary pattern and argues against treating 15 as an automatic buy signal the way a similar reading might have read earlier in the year.
BTC vs Nasdaq 100: 12-month rolling correlation (monthly data, since 2015)
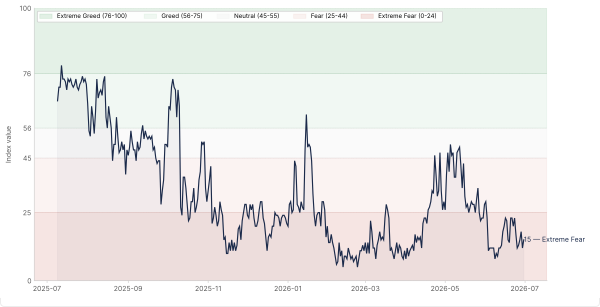
Composite sentiment index aggregating volatility, market momentum, social media activity, BTC dominance, and Google Trends. Scale: 0 = Extreme Fear, 100 = Extreme Greed. Current: 15 (Extreme Fear). Monthly average: 15.9. Source: Alternative.me
ETF flows - a record outflow month. June closed with approximately $4.3 billion in net outflows, driven mainly by consecutive days of redemptions, the worst month since the category's 2024 launch. The first week of July brought a brief return to inflows, the first green stretch since the outflow streak began. One week isn't a trend, but it's the first data point suggesting the outflow pressure may be easing rather than compounding.
Spot Bitcoin ETF Net Inflow (USD billions), Jan 2024-June 2026
Source: CoinGlass
Leverage - June's decline was a long squeeze, not a short squeeze. Open interest climbed above $111 billion heading into June with positioning skewed heavily long, setting up a run of long-liquidation cascades rather than the short-covering squeezes that had defined the market since roughly March. Large forced-selling events hit on June 2, June 3, and June 25 to 26, with longs taking the overwhelming share each time. By late June, funding had normalized to roughly neutral, a marked shift from the crowded-short conditions earlier in the year, a modest counterpoint to the otherwise bearish tone of this section.
Every thread this month points the same direction, which is itself notable given how often these signals pull against each other. The Fed turned hawkish and removed its safety net language; real yields rose in lockstep with Bitcoin's decline, rather than extending this year's debasement-hedge behavior; and equities, carried by an unrelated AI earnings cycle, simply weren't exposed to the same demand mechanics that made Bitcoin vulnerable.
On-chain, the picture is one of stalling rather than either accumulation or capitulation: ETF flows are following the macro backdrop lower rather than leading it, LTH supply growth reflects stagnation more than conviction, and the absence of a realized-loss spike means sellers haven't been fully flushed out. Layered on top of all of it, Strategy's shift from unconditional buyer to opportunistic seller is a crack in exactly the kind of price-insensitive demand that has underwritten Bitcoin's structural bid since 2020. None of these signals individually would be alarming. Together, they describe a market where the macro backdrop turned hostile at the same moment one of its most reliable buyers stopped being reliable.
Regime: Crypto-specific stress compounding a genuine macro headwind, not yet a structural breakdown.
Bitcoin's decline reflects a real macro shock, real yields rose alongside the selloff and the Fed turned authentically hawkish, layered on top of cracks specific to crypto itself: record ETF outflows across both BTC and ETH, Strategy's shift to opportunistic seller, and a long-leverage unwind that had built up since the spring. The on-chain base underneath all of it, LTH supply, MVRV, the absence of a capitulation spike, has not broken, but it hasn't strengthened either. This reads as a market stalling under pressure, not one collapsing through a floor.
Top conviction signal: The damage was concentrated in leverage and sentiment, not in the underlying holder base.
Open interest had built up heavily long since the spring, and June's worst days were long-liquidation cascades rather than long-term holders capitulating. LTH supply kept climbing through the selloff instead of distributing, and the Mt. Gox transfer that spooked the market on June 2 has since been confirmed as pre-distribution staging, not a sale. A market that flushed excess leverage and held its core holder base is showing stress, not structural failure, even with ETF flows and Strategy's policy shift both cutting the other way.
What would change our view:
- A second consecutive month of record ETF outflows, confirming a genuine demand problem rather than a one-month reaction to the Fed's tone
- Strategy drawing on the $1.25 billion authorization again, turning June's sale into a pattern rather than a single dividend-driven event
- LTH-SOPR breaking materially further below 1.0 alongside STH-SOPR, the simultaneous-cohort capitulation pattern that marked May's stress event and prior cycle lows
- Realized losses spiking toward the February or November 2022 comparisons, signaling the market has finally flushed its most reluctant sellers
- Gold failing to recover while BTC stabilizes, or vice versa, would help separate whether June was a hard-asset-wide unwind or something specific to crypto's own demand mechanics
Watching in July:
- ETF Flows - whether ETF flows stabilize on the back of the brief early-July inflow, or that proves to be noise inside a continuing outflow trend
- Strategy's next monetization disclosure - whether the $1.25 billion authorization sees further use
- Fed communication - the July 28-29 FOMC meeting, given Warsh's shorter, less forward-guided statement style, and whether "prices are too high" hardens into more concrete guidance
- The BTC/real-yield correlation - whether it continues its drift toward zero or stabilizes near June's +0.13
- MVRV's recovery - whether the early-July recovery to 0.30 holds or rolls back toward the June low
- Mt. Gox creditor distributions - now that repayments have formally begun, and whether any of that supply reaches exchanges rather than staying in cold storage
1) Strategy 2) Decrypt 3) CoinTelegraph 4) Fred 5) NBC News 6) Federal Reserve 7) Fred 8) CryptoQuant
Collapse
The full breakdown
In our first article, "Navigating Crypto Volatility: The Advantages of Active Management," we explored how the high volatility and low correlation of digital assets with traditional asset classes create unique opportunities for active managers. We discussed how these characteristics enable active managers to execute tactical trading strategies, capitalizing on short-term price movements and market inefficiencies. Building on that foundation, we now turn our attention to the unique market microstructure of digital assets.
Conducive market microstructure of digital assets
The market microstructure of digital assets - a framework that defines how crypto trades are conducted, including order execution, price formation, and market interactions - sets the stage for active management to thrive. This unique ecosystem, characterized by its continuous trading hours, diverse trading venues, and substantial market liquidity, offers several advantages for active management, providing a fertile ground for sophisticated investment strategies.
24/7/365 market access
One of the defining characteristics of digital asset markets is their continuous, round-the-clock operation.
Unlike traditional financial markets that operate within specific hours, cryptocurrency markets are open 24 hours a day, seven days a week, all year round. This continuous trading capability is particularly advantageous for active managers for several reasons:
- Immediate response to market events: Unlike traditional markets that close after regular trading hours, digital asset markets allow managers to react immediately to breaking news or events that could impact asset prices. For instance, if a significant economic policy change occurs over the weekend, managers can adjust their positions in real-time without waiting for markets to open.
- Managing volatility: Continuous trading provides more opportunities to capitalize on price movements and volatility. Active managers can take advantage of this by implementing strategies such as short-term trading or hedging to mitigate risks and lock in gains whenever market conditions change. For instance, if there’s a sudden drop in the price of Bitcoin, managers can quickly sell their holdings to minimize losses or buy in to capitalize on the lower prices.
Variety of trading venues
The proliferation and variety of trading venues is another crucial element of the digital asset market structure. The extensive landscape of over 200 centralized exchanges (CEX) and more than 500 decentralized exchanges (DEX) offers a wide array of platforms for cryptocurrency trading. This diversity is beneficial for active managers in several ways:
- Risk management and diversification: By spreading trades across various exchanges, active managers can mitigate counterparty risk associated with any single platform. Additionally, the ability to trade on both CEX and DEX platforms allows managers to diversify their strategies, incorporating different levels of decentralization, regulatory environments, and security features.
- Arbitrage opportunities: Different venues often exhibit price discrepancies, presenting arbitrage opportunities. For example, managers can buy an asset on one exchange at a lower price and sell it on another where the price is higher, thus generating risk-free profits.
- Access to diverse liquidity pools: Multiple trading venues provide access to diverse liquidity pools, ensuring that managers can execute large trades without significantly impacting the market price.
Spot and derivatives markets (Variety of instruments)
The seamless integration of spot and derivatives markets within the digital asset space presents a considerable advantage for active managers. With substantial liquidity in both markets, they can implement sophisticated trading strategies and manage risk more effectively.
For instance, as of August 8 2024, Bitcoin (BTC) boasts a daily spot trading volume of $40.44 billion and an open interest in futures of $27.75 billion. Additionally, derivatives such as futures, options, and perpetual contracts enable managers to hedge positions, leverage trades, and employ complex strategies that can amplify returns.

Overall, the benefits for active managers include:
- Hedging and risk management: Derivatives offer a powerful tool for hedging against unfavorable price movements, enabling more efficient risk management. For instance, a manager holding a substantial amount of Bitcoin in the spot market can use Bitcoin futures contracts to safeguard against potential price drops, thereby enhancing risk control.
- Access to leverage: Managers can use derivatives to leverage their positions, amplifying potential returns while maintaining control over risk exposure. For instance, by employing options, a manager can gain exposure to an underlying asset with only a fraction of the capital needed for a direct spot purchase, thereby enabling more capital-efficient investment strategies.
- Strategic flexibility: By integrating spot and derivatives markets, managers can implement sophisticated strategies designed to capitalize on diverse market conditions. For instance, they may engage in volatility selling, where options are sold to generate income from market volatility, regardless of price direction. Additionally, managers can leverage favorable funding rates in perpetual futures markets to enhance yield generation. Basis trading, another strategy, involves taking offsetting positions in spot and futures markets to profit from price differentials, enabling returns that are independent of market movements.
Exploiting market inefficiencies
Digital asset markets, being relatively nascent, are less efficient compared to traditional financial markets. These inefficiencies arise from various factors, including regulatory differences, market segmentation, and varying levels of market maturity. For example:
- Pricing anomalies: Phenomena like the "Kimchi premium," where cryptocurrency prices in South Korea trade at a premium compared to other markets, create arbitrage opportunities. Managers can exploit these by buying assets in one market and selling them in another at a higher price.
- Exploiting mispricings: Active managers can identify and capitalize on mispricings caused by market inefficiencies, using strategies such as statistical arbitrage and mean reversion.
The unique aspects of the digital asset market structure create an exceptionally conducive environment for active management. Continuous trading hours and diverse venues provide the flexibility to react quickly to market changes, ensuring timely execution of trades. The availability of both spot and derivatives markets supports a wide range of sophisticated trading strategies, from hedging to leveraging positions. Market inefficiencies and pricing anomalies offer numerous opportunities for generating alpha, making active management particularly effective in the digital asset space. Furthermore, the ability to hedge and manage risk through derivatives, along with exploiting uncorrelated performance, enhances portfolio resilience and stability.
In our next article, we'll delve into the various techniques active managers employ in the digital asset markets, showcasing real-world use cases.
Read full disclaimer


