
The bid came back. Yet, the ceiling didn’t move. | AI generated image by XBTO
The bid came back. Yet, the ceiling didn’t move. | AI generated image by XBTO

Bitcoin had its strongest month since late 2024 and still trades below where it started the year. Gold rose nearly 10% alongside it, while equities posted more modest gains. Yet Bitcoin still trailed ETH, SOL and XRP. Demand returned in size, but not enough to push Bitcoin decisively through $82,000.
The month in brief
August was Bitcoin’s strongest month since November 2024, when it gained 37.29%, yet BTC was the weakest of the four major coins we track. BTC rose 24.95%, compared with 32.48% for ETH, 29.94% for XRP and 41.43% for SOL. Traditional risk assets also advanced, but on a much smaller scale: the S&P 500 gained 2.62% and the Nasdaq 3.93%, while the dollar index was effectively unchanged at -0.37%. Gold was the notable exception, up 9.93% alongside crypto rather than against it.
Monthly asset returns - August 2026 (%)
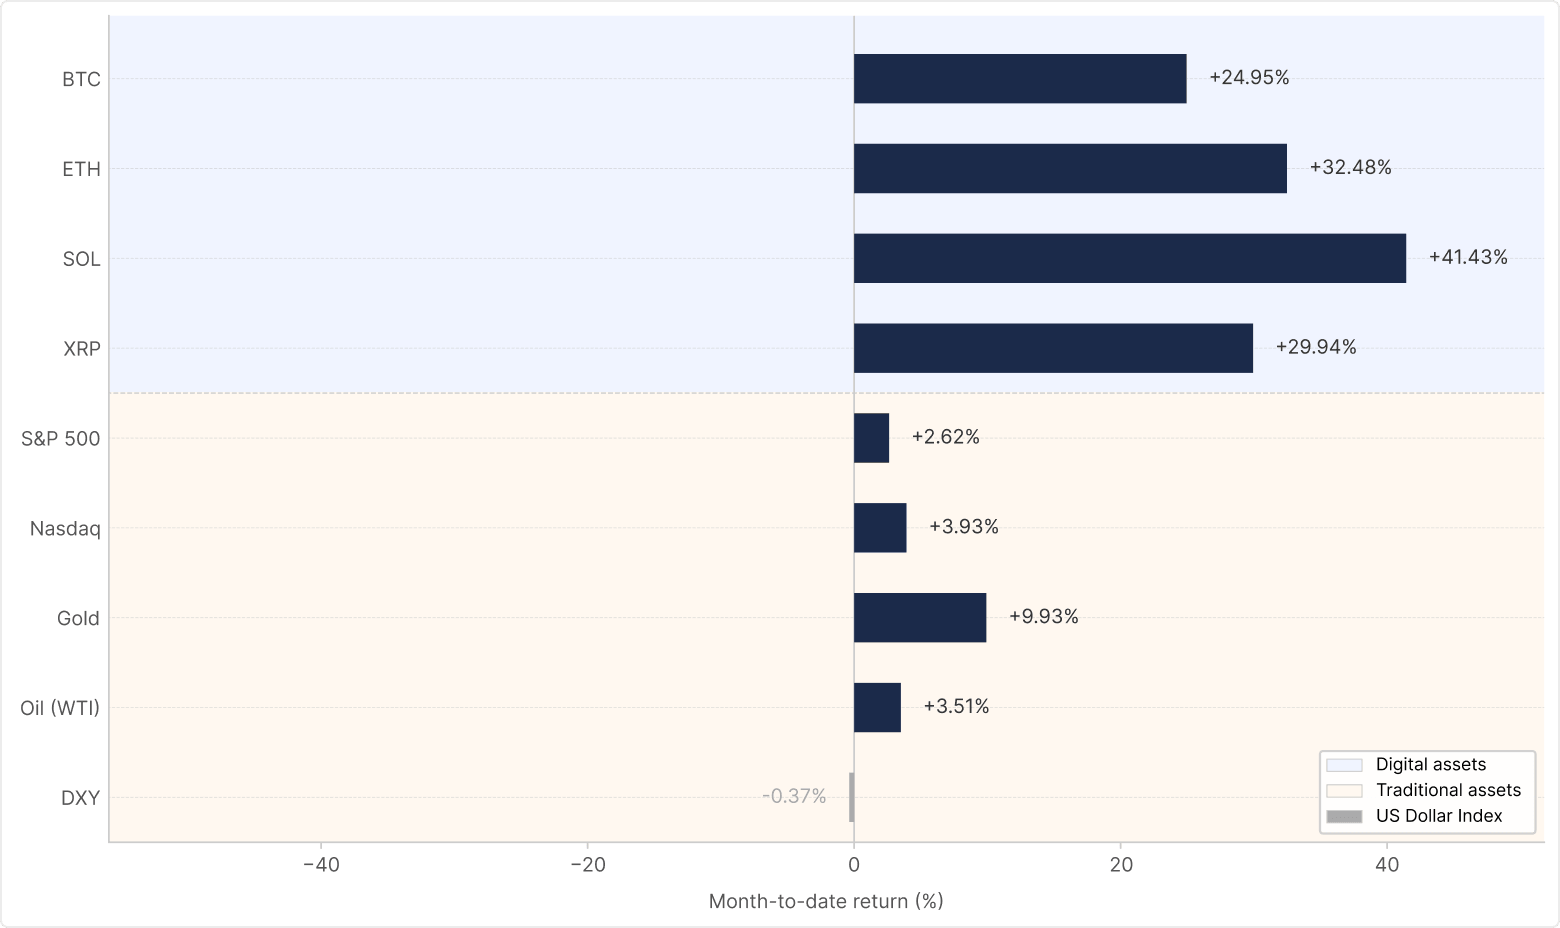
Month-to-date returns for selected crypto and traditional assets as of 31 August 2026. Crypto sourced from Binance (USDT pairs, monthly close). Traditional assets from Yahoo Finance (monthly close, price return only); oil proxied by USO ETF.
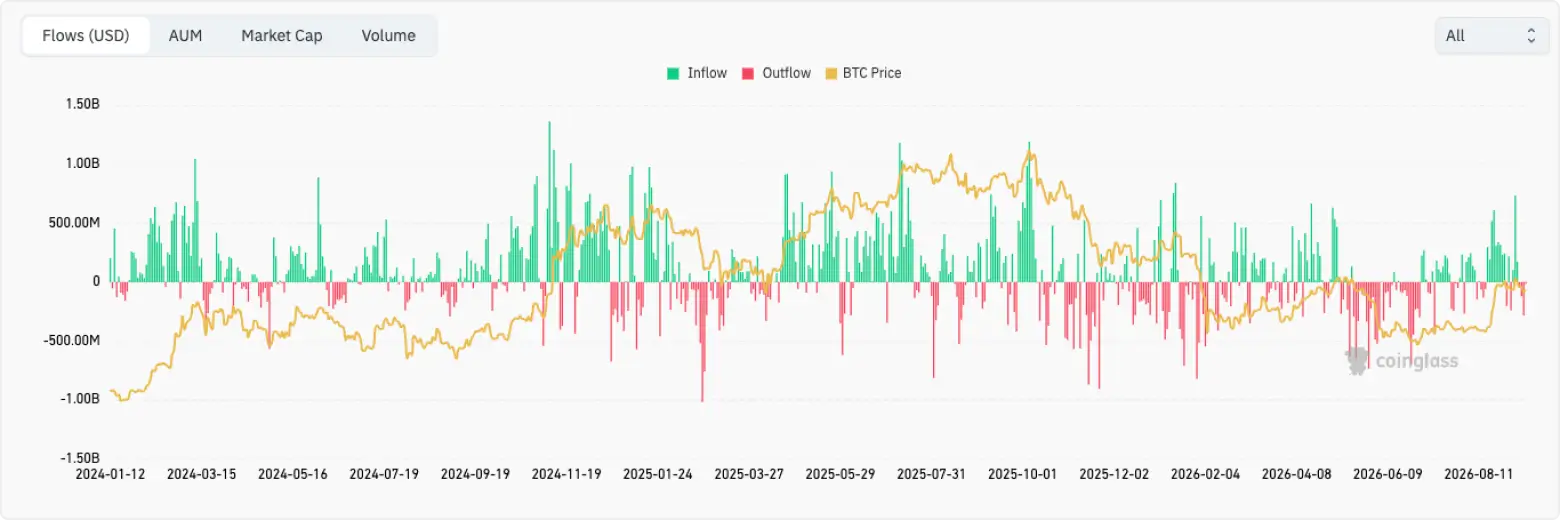
Two figures put the move in perspective. Bitcoin remains roughly 10% below where it started the year, having opened 2026 near $88,800. Meanwhile, US spot Bitcoin ETFs attracted $3.52 billion over the month, with outflows on only five of 21 sessions, compared with $5.30 billion of net outflows between January and July. One month did not just beat the year; it reversed most of it.
What triggered August’s rally
The catalyst came from the Treasury, not the Fed. On August 19, the Treasury announced it would at least double the size of its long-end liquidity-support buybacks, from a maximum of $2 billion to at least $4 billion each, beginning from September 9 through early November. The announcement came as the 30-year Treasury yield had reached its highest level since 2007. Markets read it as a signal that the Treasury was prepared to lean against deteriorating liquidity in the long-end of the bond market. Yields fell sharply, the dollar weakened and scarce assets repriced. Positioning amplified the move: more than $1 billion of Bitcoin shorts were closed in roughly an hour, part of the largest wave of crypto short liquidations recorded since 2021.1
The squeeze was then reinforced by genuine spot demand. ETF flows had already returned to net inflows before the Treasury announcement, then accelerated sharply afterwards, running positive for nine consecutive sessions from August 17 to 27. Strategy also returned to buying after roughly ten weeks. Strategy sold 1,690 BTC at $64,262 in the first week of August to fund preferred repurchases, then bought 4,603 BTC at $80,318 in the last week once price had cleared its $75,412 cost basis.2 In net terms, it added 2,913 BTC, having sold near the low and bought near the high. Strategy supplied into weakness and bought into strength, and August's flows broadly followed price rather than leading it.
The momentum faded at month-end. At Jackson Hole on August 28, Chair Warsh said he would be “hard pressed” to describe broad financial conditions as restrictive, while reiterating that inflation remained too high. Markets took the message as leaving the door open to further tightening. Bitcoin fell roughly 3% on the day, September hike expectations rose above 50%, and by month-end the 10-year Treasury yield was back near 4.8%. The relief triggered by the Treasury announcement had proved powerful, but temporary.
The advance stopped in the same place where it had in the spring. Bitcoin failed at $81,265 on August 25 and $81,480 on August 28, close to the same band that rejected May’s rally after a peak of $82,814. The $80,000 to $82,000 area therefore matters for more than one reason: it contains the 50-week moving average, near $81,000, and overlaps with the aggregate cost basis of a significant portion of US ETF holders.3 Bitcoin briefly closed above its 50-week average on September 3 for the first time since November 2025, only to fall back below it within days.
Macro backdrop
August also challenged some of the usual explanations for Bitcoin’s behaviour. Over the past year, its relationship with both real yields and equities has weakened, while the simple global-liquidity narrative has struggled to explain the path of returns. That does not amount to decoupling. It suggests instead that Bitcoin is being driven by a broader mix of macro, positioning and crypto-specific forces than it was earlier in the cycle.
1. Real yields: the relationship has faded
BTC vs 10Y real yields: 12-month rolling correlation
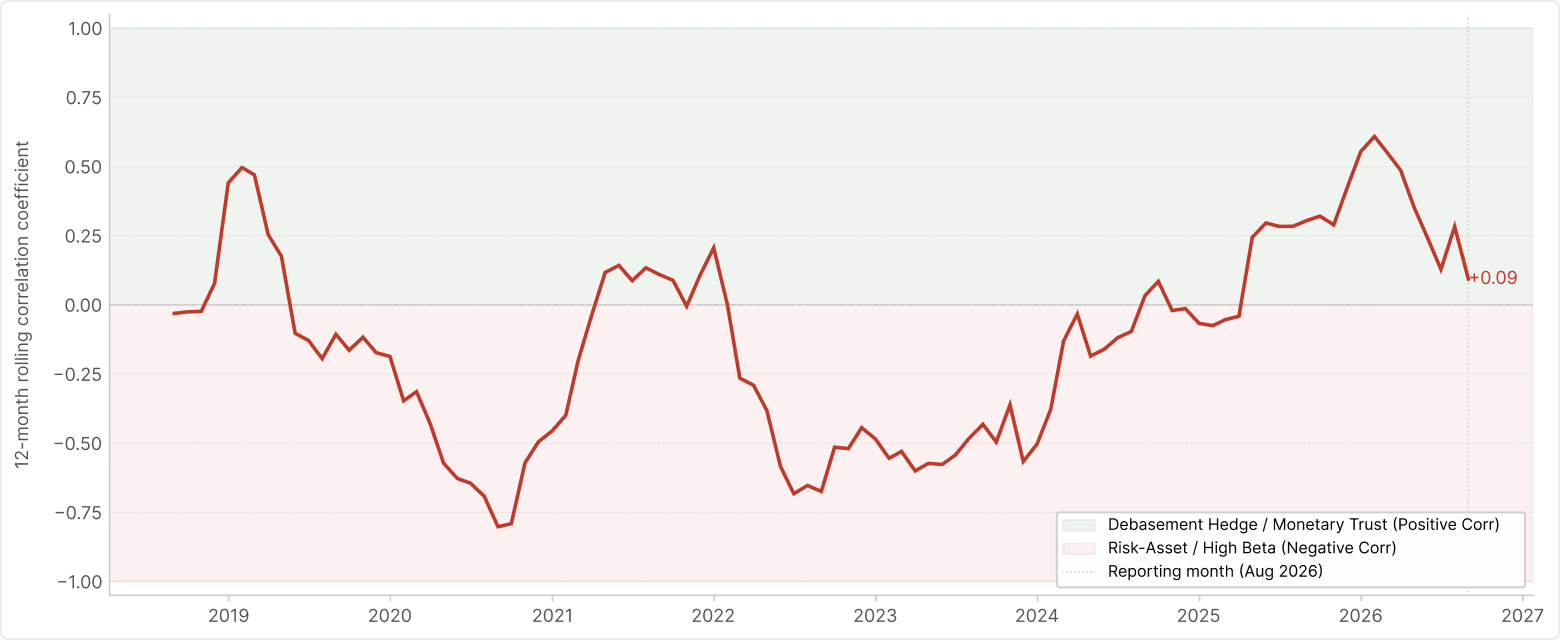
12-month rolling Pearson correlation between BTC monthly returns and monthly changes in the 10Y TIPS real yield (FRED: DFII10). Positive zone = BTC behaving as a debasement hedge. Negative zone = BTC behaving as a rate-sensitive risk asset. Current reading: +0.09 (August 2026). Source: FRED (DFII10), Binance (BTC/USDT monthly close).
The 12-month rolling correlation between Bitcoin's monthly returns and changes in the 10-year TIPS real yield has fallen to +0.09, from +0.61 earlier in 2026. The important point is not the sign, but its proximity to zero: over this window, changes in real yields have explained relatively little of Bitcoin’s direction.
August fits that pattern. Real yields moved higher, normally a headwind for duration-sensitive assets, while Bitcoin gained almost 25%. One month does not establish independence from rates, but it reinforces the idea that the relationship has become less stable than it was earlier in the year.
2. Gold: a shared August impulse, not yet a shared regime
BTC vs Gold: Growth of $100, August 2025-2026
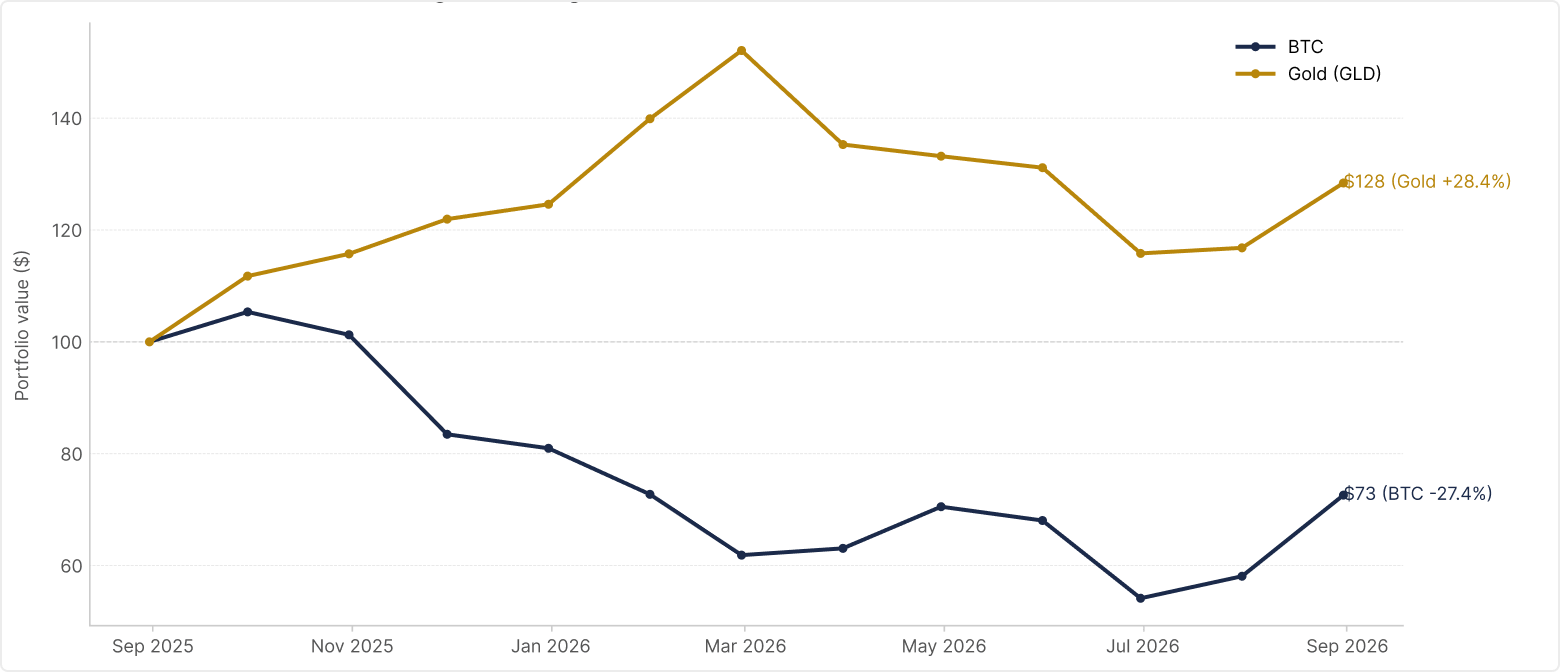
Source: Binance (BTC/USDT monthly close), Yahoo Finance (GLD monthly close)
Gold gained 9.93% in August alongside Bitcoin's 24.95%, with both responding to the same Treasury catalyst while equities posted more modest gains.
It is tempting to read that as evidence that Bitcoin was trading increasingly as a monetary hedge. The broader picture argues for more caution. Over the past year, gold and Bitcoin have followed very different paths, so one month of co-movement does not yet establish a common regime.
The relative performance within crypto points in the same direction. If August had been predominantly a hard-asset or monetary-hedge trade, Bitcoin might have been expected to lead. Instead, SOL, ETH and XRP all outperformed it. The more convincing interpretation is that two forces were operating at once: a hard-asset bid linked to the macro catalyst, and a broader increase in risk appetite within digital assets.
3. Equity correlation: lower, but not yet a decoupling signal
BTC vs Nasdaq 100: 12-month rolling correlation (monthly data, since 2015)
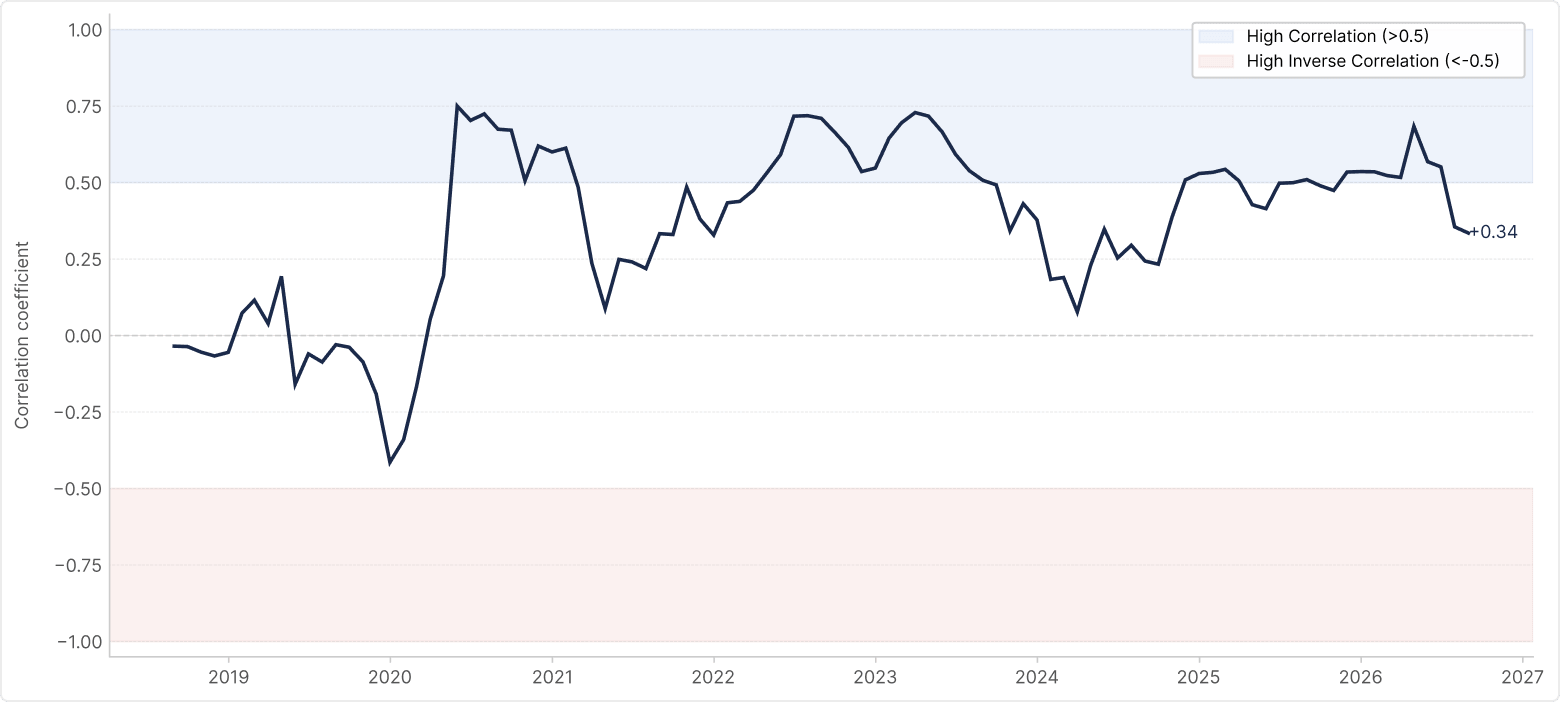
12-month rolling Pearson correlation between BTC monthly returns and Nasdaq 100 monthly returns. A correlation above 0.5 indicates BTC is trading with high-beta tech characteristics. A sustained move below 0.5 supports the thesis that BTC is maturing as a distinct asset class. Current reading: +0.34 (August 2026). Source: Binance (BTC/USDT monthly close), Yahoo Finance (^NDX monthly close)
Bitcoin’s 12-month rolling correlation with the Nasdaq has fallen to +0.34, from +0.68 earlier this year. This is a meaningful decline, but August offered only a partial test of the relationship because both assets moved in the same direction.
Bitcoin outperformed the Nasdaq by roughly 21 points, showing that the magnitude of the crypto move was driven by forces beyond conventional equity beta. But it did not rise while equities fell, which would provide a much stronger test of genuine diversification.
For now, the evidence points to a weaker equity relationship rather than a broken one. A sustained period of lower correlation, particularly through an equity drawdown or broader risk-off episode, would provide much stronger evidence that Bitcoin’s macro regime is changing.
On-chain pulse
Three things stand out beneath the price action. Supply shifted from longer-term towards newer holders, institutional spot demand improved materially, and derivatives suggest that short covering amplified the rally without triggering a comparable build-up in leveraged longs. That combination is healthier than a leverage-driven rally, but it is not yet evidence of broad accumulation.
MVRV Z-Score - Closed August at 0.87, up from 0.29 at the July close.* Valuation recovered from depressed levels without approaching the extremes associated with previous cycle peaks. Historically, low readings have tended to coincide with accumulation phases, while late-cycle peaks have occurred at much higher levels. At 0.87, MVRV does not suggest that Bitcoin is expensive by historical cycle standards. The resistance around $82,000 therefore looks more like a question of supply and marginal demand than broad market euphoria.
Bitcoin MVRV Z-Score, August 2024-2026
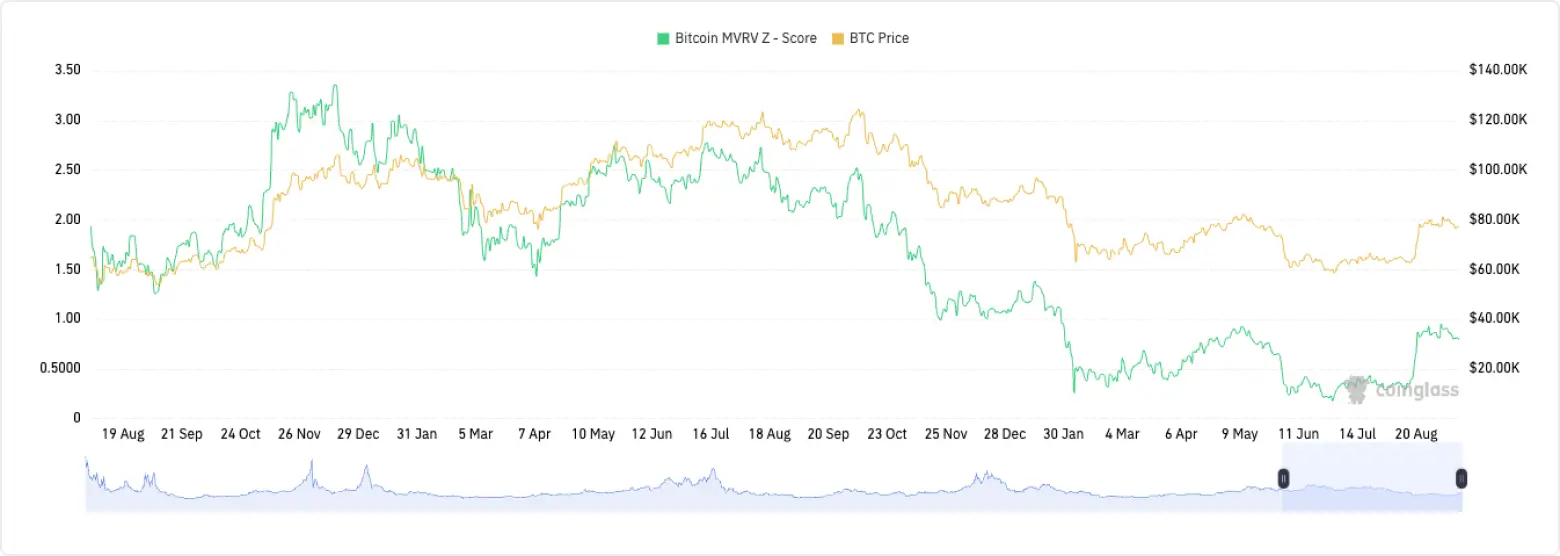
Source: Coinglass * MVRV-Z Score is a relative indicator used to measure how much Bitcoin’s circulating market value deviates from its realized market value, normalized by the standard deviation of the circulating market value.
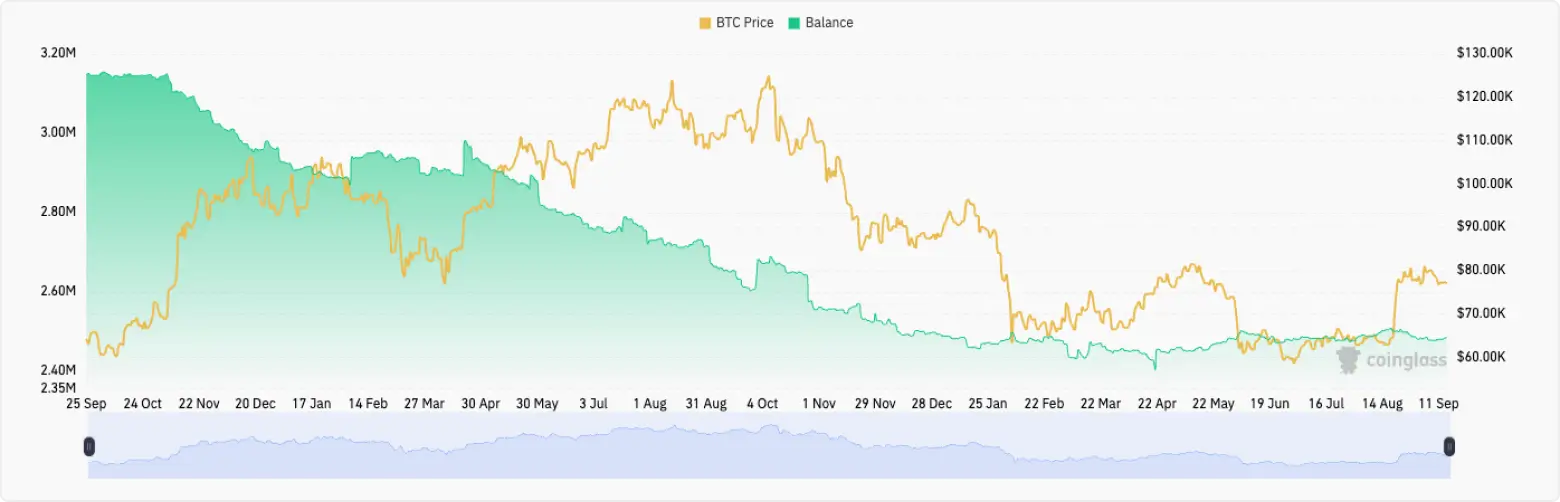
Exchange reserves - The aggregate figure remains flat, at 2.48M BTC. Underneath that value, Binance's reserves rose above 693,000 BTC, their highest level in two years.4 Coins concentrating on the deepest venue is the opposite of the migration to cold storage that has defined the past two years, and it puts more supply within immediate reach of the order book. This potentially creates more sell-side pressure, which may partially explain why Bitcoin struggled to hold above $80,000 while demand was improving across other assets in the market.5
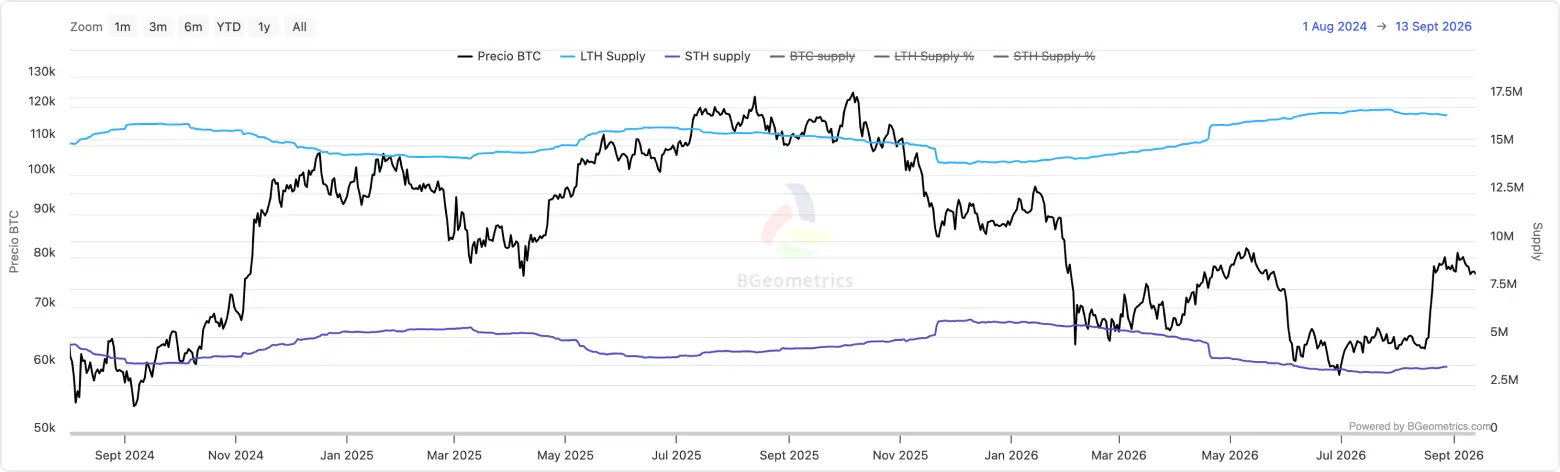
Long-term holder supply vs. short-term holder supply - Roughly 200,000 BTC changed hands from patient holders to recent ones. Long-term holder supply fell to 16.6 million BTC from 16.8 million at the July close, while short-term holder supply rose to 3.5 million from 3.3 million. August did not expand ownership, it rotated it toward the cohort most sensitive to drawdowns. In terms of realized profits by these cohorts, LTH-SOPR closed at 1.18, meaning coins moved by holders of more than 155 days were realising an average profit of 18%. STH-SOPR closed at exactly 1.00, meaning the cohort that bought during the rally is, in aggregate, at breakeven. Bitcoin remains below a concentration of long-term holder supply around $83,000 to $85,000, and the recent buyers have no profit cushion to absorb a test of it.
BTC dominance - Dominance fell, and the rotation was internal to crypto rather than into it. Bitcoin ended August at 59.71% and slipped to 58.8% in the first weeks of September, with Ethereum taking most of what it gave up, rising from 10.4% in early August to 11.6% by early September.6 Dominance falling during the strongest month in nearly two years is consistent with the return dispersion, where ETH, SOL and XRP all outperformed. BTC dominance has continued to fall into September, after Bitcoin stalled, which suggests the move into Ethereum was not just a side-effect of the squeeze.
Fear & Greed Index - Sentiment closed at 62 in Greed. This is the first Greed reading since January 2026, against a monthly average of 45.3. Sentiment spent most of this year below where price action alone would suggest. It has now caught up, at the same point short-term holders reached breakeven.
Crypto Fear & Greed Index: trailing 12 months (daily)
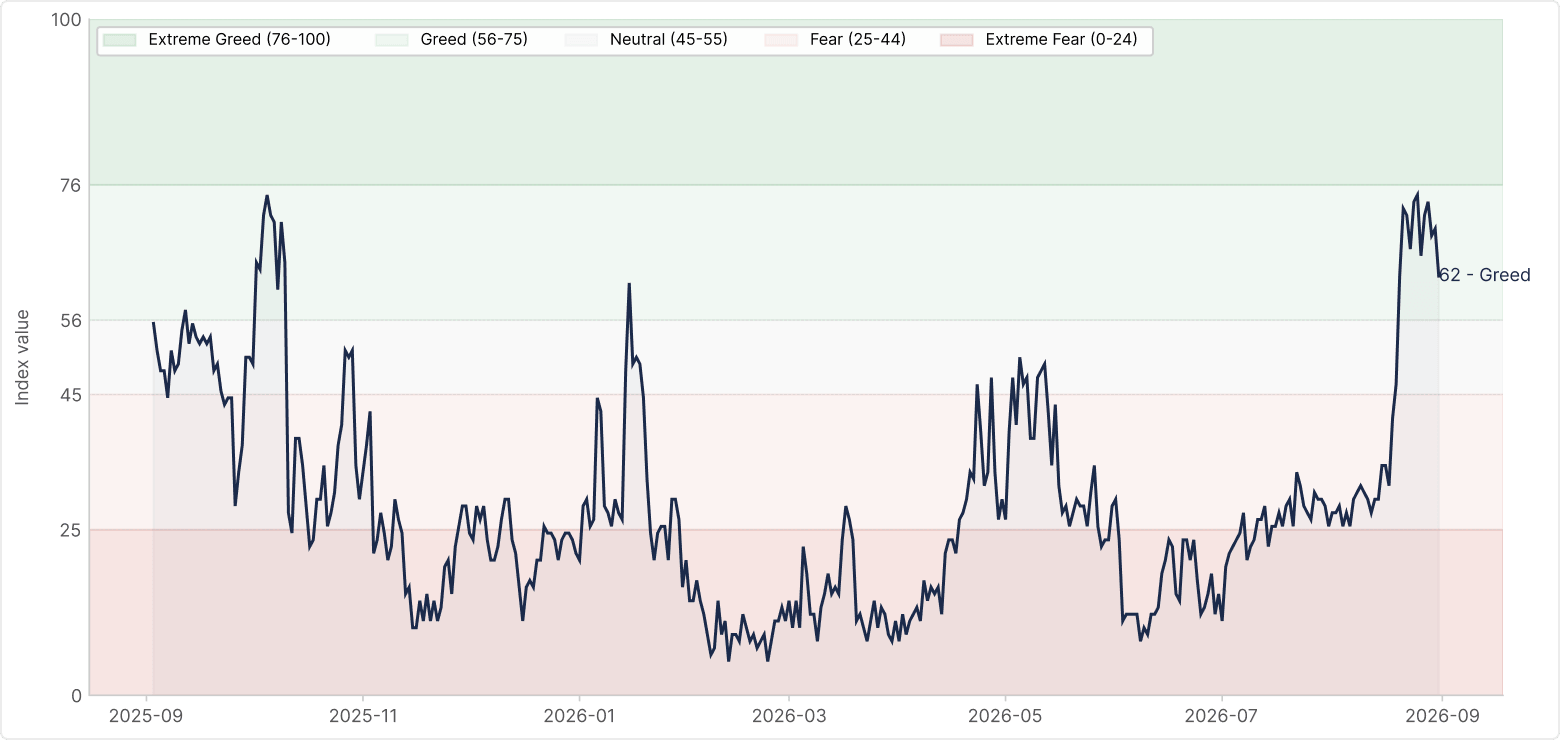
Composite sentiment index aggregating volatility, market momentum, social media activity, BTC dominance, and Google Trends. Scale: 0 = Extreme Fear, 100 = Extreme Greed. Current: 62 (Greed). Monthly average: 45.3. Source: Alternative.me
ETF flows - Spot Bitcoin ETFs took in $3.52 billion in August, with redemptions on only five of 21 sessions. Set against roughly 13,300 BTC of monthly issuance, that is several multiples of new supply absorbed.7 Two qualifications matter: the flows nearly reversed the year rather than adding to it, since January through July recorded $5.30 billion of net outflows. And the first week of September brought the first net outflows since the rally began, which makes August's total a reversal rather than an established trend.
Futures open interest - A five-month low, reached during the rally. This explains why BTC stopped where it did. Leverage usually builds during a rally of this size. Instead, Bitcoin-denominated futures open interest fell to a five-month low, meaning shorts closing positions supplied most of the buying. That demand had a finite size and it ran out. Bitcoin has failed twice at the low $81,000s since August 23, and the most recent week opened near $77,000, ran to $81,455 and closed at $77,838, finishing almost exactly where it started.
The macro & on-chain synthesis
What is unusual about August is not that demand returned, but that everything else moved against it and price still rose. The Fed turned more hawkish into the rally; real yields rose against Bitcoin; global liquidity has been expanding for twelve months while Bitcoin fell; and equities, comparatively subdued, were not the source of the impulse. The move came from a squeeze on the back of a fiscal signal, and the buyers arrived after it.
On-chain, the picture is one of transfer rather than expansion: roughly 200,000 BTC moved from long-term holder hands to recent ones, futures open interest fell to a five-month low while price climbed, Binance reserves rose to a two-year high, and short-term holders sit at exactly breakeven. Layered on top, Strategy sold into weakness and bought into strength, which is the same price-following pattern the ETF flows show, arriving nine sessions into the move rather than ahead of it. Together, these signals describe a rally that transferred ownership without building conviction at that price.
That is why the $80,000 to $82,000 band has held repeatedly. Roughly 8% of total supply was acquired there, and clearing it requires a buyer willing to hold above the cost basis of the people selling. August's marginal buyer was at breakeven, which is the shortest horizon in the market. Whether that band clears depends on the rate path, and September brings the first possible hike since July 2023.
Our monthly call
Regime: constructive on demand, constrained on price. The first half of the year was defined by the absence of a persistent marginal buyer. August changed that: ETF demand returned and broader risk appetite improved. But buyers have not yet proved willing to absorb the supply sitting above $80,000 when the macro backdrop turns less supportive. The demand problem has eased; the price-clearing problem has not.
Top conviction signal: demand followed price rather than leading it. Strategy bought only after Bitcoin cleared its cost basis, ETF inflows began nine sessions into the move, and futures open interest fell to a five-month low while price rose. Every part of August's demand was reactive. That is the most defensible signal of the month and the reason a 25% gain has not established a new range.
What would change our view: a sustained break above $82,000 driven by spot rather than leveraged demand would be the first sign that the marginal buyer has changed. ETF inflows persisting through a drawdown rather than only into strength would say the same thing in flow terms. On the other side, a decisive break below $76,800 would put price back under the cost basis of those who bought in August and turn a breakeven cohort into a selling one.
Watching in September
Bitcoin benefits from lower yields, a softer dollar and improving liquidity, and is pressured by higher oil and renewed inflation. Those forces currently point in opposite directions, which is what makes the following the variables worth tracking in September:
- The FOMC decision on the 16th: the guidance matters more than the move. A hike is largely priced. A signalled sequence is not. October follow-on odds near 60% are where the risk sits.
- The $80,000 to $82,000 band: where on-chain supply and technical resistance coincide. The May peak at $82,814 is the first level, with the December 2025 lows just above it, and long-term holder supply concentrated through the same zone.
- The dollar: DXY was effectively flat in August at -0.37% and has stayed soft while yields rose, which is part of why Bitcoin held up better than the rate move alone would suggest. A dollar that firms alongside a hawkish Fed removes that support.
- Whether long-term holder supply stabilises: a month of net accumulation would say the overhang is clearing rather than pausing.
- Oil above $100: this feeds the inflation impulse the Fed is responding to and was not captured in the August CPI print.
Collapse
The full breakdown
In our first article, "Navigating Crypto Volatility: The Advantages of Active Management," we explored how the high volatility and low correlation of digital assets with traditional asset classes create unique opportunities for active managers. We discussed how these characteristics enable active managers to execute tactical trading strategies, capitalizing on short-term price movements and market inefficiencies. Building on that foundation, we now turn our attention to the unique market microstructure of digital assets.
Conducive market microstructure of digital assets
The market microstructure of digital assets - a framework that defines how crypto trades are conducted, including order execution, price formation, and market interactions - sets the stage for active management to thrive. This unique ecosystem, characterized by its continuous trading hours, diverse trading venues, and substantial market liquidity, offers several advantages for active management, providing a fertile ground for sophisticated investment strategies.
24/7/365 market access
One of the defining characteristics of digital asset markets is their continuous, round-the-clock operation.
Unlike traditional financial markets that operate within specific hours, cryptocurrency markets are open 24 hours a day, seven days a week, all year round. This continuous trading capability is particularly advantageous for active managers for several reasons:
- Immediate response to market events: Unlike traditional markets that close after regular trading hours, digital asset markets allow managers to react immediately to breaking news or events that could impact asset prices. For instance, if a significant economic policy change occurs over the weekend, managers can adjust their positions in real-time without waiting for markets to open.
- Managing volatility: Continuous trading provides more opportunities to capitalize on price movements and volatility. Active managers can take advantage of this by implementing strategies such as short-term trading or hedging to mitigate risks and lock in gains whenever market conditions change. For instance, if there’s a sudden drop in the price of Bitcoin, managers can quickly sell their holdings to minimize losses or buy in to capitalize on the lower prices.
Variety of trading venues
The proliferation and variety of trading venues is another crucial element of the digital asset market structure. The extensive landscape of over 200 centralized exchanges (CEX) and more than 500 decentralized exchanges (DEX) offers a wide array of platforms for cryptocurrency trading. This diversity is beneficial for active managers in several ways:
- Risk management and diversification: By spreading trades across various exchanges, active managers can mitigate counterparty risk associated with any single platform. Additionally, the ability to trade on both CEX and DEX platforms allows managers to diversify their strategies, incorporating different levels of decentralization, regulatory environments, and security features.
- Arbitrage opportunities: Different venues often exhibit price discrepancies, presenting arbitrage opportunities. For example, managers can buy an asset on one exchange at a lower price and sell it on another where the price is higher, thus generating risk-free profits.
- Access to diverse liquidity pools: Multiple trading venues provide access to diverse liquidity pools, ensuring that managers can execute large trades without significantly impacting the market price.
Spot and derivatives markets (Variety of instruments)
The seamless integration of spot and derivatives markets within the digital asset space presents a considerable advantage for active managers. With substantial liquidity in both markets, they can implement sophisticated trading strategies and manage risk more effectively.
For instance, as of August 8 2024, Bitcoin (BTC) boasts a daily spot trading volume of $40.44 billion and an open interest in futures of $27.75 billion. Additionally, derivatives such as futures, options, and perpetual contracts enable managers to hedge positions, leverage trades, and employ complex strategies that can amplify returns.

Overall, the benefits for active managers include:
- Hedging and risk management: Derivatives offer a powerful tool for hedging against unfavorable price movements, enabling more efficient risk management. For instance, a manager holding a substantial amount of Bitcoin in the spot market can use Bitcoin futures contracts to safeguard against potential price drops, thereby enhancing risk control.
- Access to leverage: Managers can use derivatives to leverage their positions, amplifying potential returns while maintaining control over risk exposure. For instance, by employing options, a manager can gain exposure to an underlying asset with only a fraction of the capital needed for a direct spot purchase, thereby enabling more capital-efficient investment strategies.
- Strategic flexibility: By integrating spot and derivatives markets, managers can implement sophisticated strategies designed to capitalize on diverse market conditions. For instance, they may engage in volatility selling, where options are sold to generate income from market volatility, regardless of price direction. Additionally, managers can leverage favorable funding rates in perpetual futures markets to enhance yield generation. Basis trading, another strategy, involves taking offsetting positions in spot and futures markets to profit from price differentials, enabling returns that are independent of market movements.
Exploiting market inefficiencies
Digital asset markets, being relatively nascent, are less efficient compared to traditional financial markets. These inefficiencies arise from various factors, including regulatory differences, market segmentation, and varying levels of market maturity. For example:
- Pricing anomalies: Phenomena like the "Kimchi premium," where cryptocurrency prices in South Korea trade at a premium compared to other markets, create arbitrage opportunities. Managers can exploit these by buying assets in one market and selling them in another at a higher price.
- Exploiting mispricings: Active managers can identify and capitalize on mispricings caused by market inefficiencies, using strategies such as statistical arbitrage and mean reversion.
The unique aspects of the digital asset market structure create an exceptionally conducive environment for active management. Continuous trading hours and diverse venues provide the flexibility to react quickly to market changes, ensuring timely execution of trades. The availability of both spot and derivatives markets supports a wide range of sophisticated trading strategies, from hedging to leveraging positions. Market inefficiencies and pricing anomalies offer numerous opportunities for generating alpha, making active management particularly effective in the digital asset space. Furthermore, the ability to hedge and manage risk through derivatives, along with exploiting uncorrelated performance, enhances portfolio resilience and stability.
In our next article, we'll delve into the various techniques active managers employ in the digital asset markets, showcasing real-world use cases.
Read full disclaimer
1) 21 Shares 2) Strategy 3) Coindesk 4) Yahoo Finance 5) CryptoQuant 6) Coinglass 7) IG