
The bid ran dry at $82,000 | AI generated image by XBTO

BTC extended April's rally into early May, peaking at $82,400 before failing at the 200-day moving average. A new Fed Reserve chair took office. Inflation broadened beyond energy for the first time this cycle. Institutional ETF flows reversed after a record April.
April's geopolitical relief trade carried into early May. BTC rallied ~37% from its April lows, peaked at $82,400 on May 6, and ran directly into the 200-day simple moving average (SMA). This is the line that separates a bear-market bounce from a genuine recovery; and it failed to cross that threshold. By month-end, BTC had drifted back to ~$73,000, finishing the month modestly negative.
Monthly asset returns - May 2026 (%)

Month-to-date returns for selected crypto and traditional assets as of 31 May 2026. Crypto sourced from Binance (USDT pairs, monthly close). Traditional assets from Yahoo Finance (monthly close, price return only); oil proxied by USO ETF.
Equities told a different story. The S&P 500 and Nasdaq rallied on earnings momentum and rate optimism, leaving BTC as one of the weakest major assets in May, contrary to March's outperformance. The contrast is not a signal of structural deterioration. It is a signal that BTC's next move requires a specific catalyst, and that catalyst did not arrive in May.
When a risk asset trades below its 200-day SMA, portfolio managers classify it as being in a downtrend. When it reclaims it convincingly, that classification changes, and with it, the investable universe for many systematic and rules-based funds. BTC crossed below the 200-day SMA in late November 2025, when price rolled over from $108,000. Every rally attempt since has failed to reclaim it. May was the most credible attempt yet, and its failure carries specific information about what the market is and is not prepared to do.
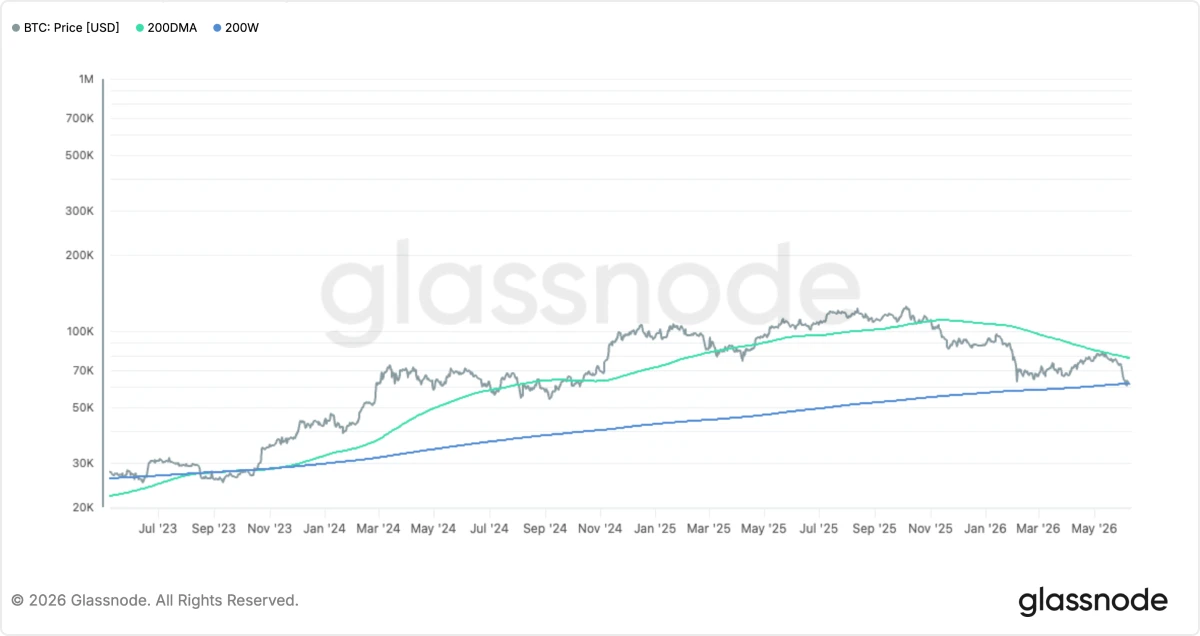
Source: glassnode
At $82,400 on May 6, BTC hit the confluence of the 200-day SMA at $82,455 and the 200-day EMA at $82,027 simultaneously. When two widely-watched moving averages converge this tightly, they form a technically reinforced resistance zone, not just a single line, but a band of supply that requires a genuine increase in demand to absorb. BTC stalled immediately on contact with that band and spent the subsequent three weeks drifting lower, closing May near $73,000.
Why it failed: a demand problem, not a supply problem
As previously pointed out by CryptoQuant's analysis in April, the rally was built on three demand drivers: leveraged futures positioning, spot demand, and ETF inflows. All three factors weakened simultaneously as price approached the 200-day SMA zone. This is the technical signature of a momentum-driven move running out of fuel at a known ceiling. The Bull Score Index fell from 40 to 20, matching the February-March period when BTC was trading between $60,000 and $66,000. The Coinbase bitcoin premium remained negative through much of the rally, confirming that U.S. spot buyers were not leading the move.1 The rally was real. The conviction behind it was thinner than the price action suggested.
K33 Research and CryptoQuant both note this rejection mirrors the 2022 structure: a 43% relief rally into the 200-day moving average, failure to hold, then a ~40% decline from the rejection point. The current setup produced a 37% rally before the same wall.2 The critical difference is what sits underneath: spot ETFs accumulating daily, LTH supply at 78%, and exchange reserves at six-year lows were absent in 2022.
The macro landscape in May did not hand BTC the catalyst it needed to break through the 200-day SMA. Rates stayed restrictive, liquidity improved only at the margins, and the market's classification of BTC as a risk asset rather than a macro hedge kept institutional positioning cautious. Three signals tell that story with precision:
1. A new Fed chair who has not yet acted
Although seemingly crypto-sympathetic, Kevin Warsh has not yet signalled his rate path, hence the market’s non-reaction to his confirmation. The constraint in May was not regulatory: it was liquidity. Until Warsh acts at the June FOMC, the market has no new information to price.
Beyond the Fed chair question, the rate environment itself is shifting in ways that matter for how BTC is being held and classified. BTC’s sensitivity to real yields has been the defining macro relationship of the 2022-2026 period. The 10-year TIPS yield closed May at 2.07%.3 The 12-month rolling correlation between BTC and real yield changes currently sits in positive territory, meaning BTC has been rising alongside real yields over the past year. This is a structural departure from the 2020-2023 regime, where falling real yields were the primary BTC tailwind.

12-month rolling Pearson correlation between BTC monthly returns and monthly changes in the 10Y TIPS real yield (FRED: DFII10). Positive zone = BTC behaving as a debasement hedge. Negative zone = BTC behaving as a rate-sensitive risk asset. Current reading: +0.24 (May 2026). Source: FRED (DFII10), Binance (BTC/USDT monthly close).
At the moment, BTC is neither a clean debasement hedge nor a clean risk asset. It is oscillating between the two depending on which catalyst is dominant that month. It’s worth noting the significant pullback in May, down to +0.24, consistent with BTC reverting toward risk-asset behaviour as the sell-off hit and sentiment deteriorated. When Warsh signals his rate path, this correlation is likely the first place it will show up.
2. Inflation broadened beyond energy
April CPI came in at 3.8%, above the 3.7% consensus, with energy accounting for 40% of the increase but shelter and food also rising.4 This broadening matters because it shifts the Fed from watching an energy-driven spike to monitoring pass-through inflation. Rate hike odds remain below 50% on CME FedWatch but are rising.5 For BTC, broadening inflation is a double-edged signal: it supports the long-term debasement hedge narrative, but in the near term it keeps the Fed on hold, which keeps the macro ceiling intact.
The more striking data point sits in the M2 picture. Global M2 expansion is one of the most reliable leading indicators for BTC performance across cycles. When central banks collectively expand their balance sheets, liquidity finds its way into risk assets including crypto. Global M2 is currently growing at over 10% year-on-year, driven by Chinese stimulus, European monetary accommodation, and the end of the Fed's QT programme.
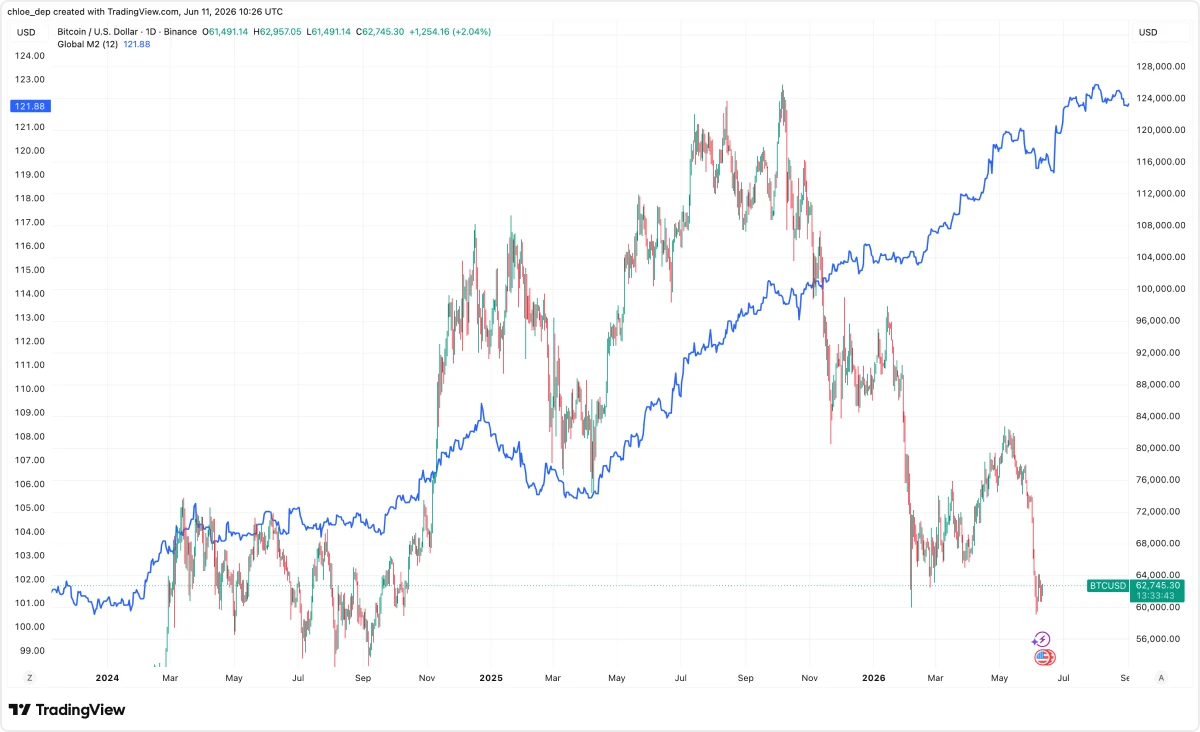
Source: TradingView
Historically, this level of global liquidity expansion has been one of the most reliable leading indicators for BTC, with a transmission lag of roughly 1-2 months. According to CF Benchmarks, the R-squared between BTC and global M2 has fallen from 0.71-0.90 during the 2022 contraction to approximately 0.59 as of February 1st, 2026, meaning the relationship has since weakened but is not broken.6
Two explanations are plausible: either BTC is substantially undervalued relative to the liquidity environment and will close the gap in Q3 as the lag resolves, or structural headwinds are suppressing the transmission mechanism. The resolution of that tension is one of the most important macro questions for Q3.
3. BTC still performing like a risk asset

12-month rolling Pearson correlation between BTC monthly returns and Nasdaq 100 monthly returns. A correlation above 0.5 indicates BTC is trading with high-beta tech characteristics. A sustained move below 0.5 supports the thesis that BTC is maturing as a distinct asset class. Current reading: +0.57 (May 2026). Source: Binance (BTC/USDT monthly close), Yahoo Finance (^NDX monthly close)
The 12-month rolling correlation between BTC and the Nasdaq 100 stands at approximately +0.57, still in high positive territory, meaning the market continues to classify BTC as a risk asset that moves broadly with equities. That classification is part of why the 200-day SMA held: in a month where equities rallied on rate optimism and BTC was stuck below a major resistance level, institutional allocators with risk-asset frameworks had little reason to add exposure.
The directional shift, however, is worth noting. A sustained move below +0.30 over two to three months would materially change how rules-based and systematic funds position BTC, expanding the institutional universe that can hold it. That reclassification, when it comes, is one of the more underappreciated catalysts available to BTC that does not depend on a Fed pivot or a macro shock.
The on-chain picture through most of May told a constructive story. The floor was holding, until the thesis was stress-tested in the final days of the month. Here is what the data shows at month-end:
MVRV Z-Score – the trajectory is the signal. Falling from 0.7 at the start of May to 0.65 at month-end to 0.34 in early June, the Z-score is approaching the historically significant green zone, the range where market price converges with the aggregate on-chain cost basis of all current holders. Prior bottoms printed near zero (2018: -0.2; 2022: -0.1), but the market is not there yet, and the STH/LTH profitability convergence that has confirmed final lows in prior cycles has not yet occurred. The floor may be forming.
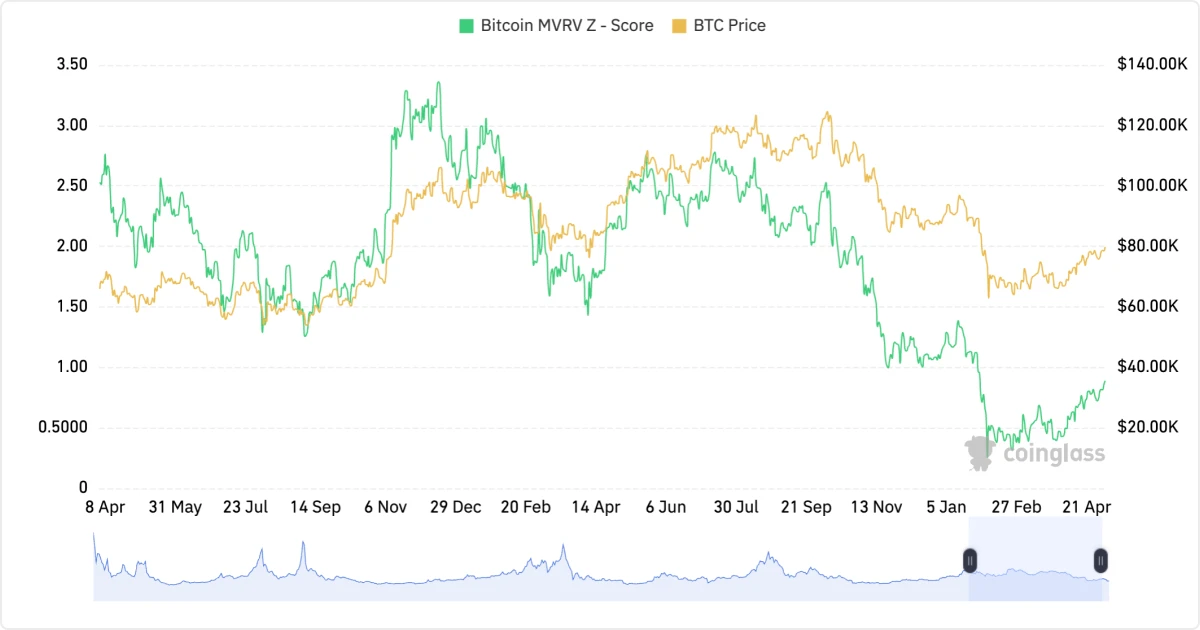
Source: CoinGlass
Exchange reserves - marginally higher. Exchange reserves stood at approximately 2.46M BTC at last month's reading per CoinGlass, edging up to 2.48M by end of May and approaching 2.5M in early June. The directional shift indicates coins returning to exchanges during the sell-off and is consistent with short-term holders positioning to exit, which is likely a contributing factor to the $74,000 floor break. But the magnitude is modest: reserves remain at historically low levels and this move does not constitute a structural supply reversal. The level to watch in June is whether reserves continue climbing, which would indicate sustained distribution pressure, or stabilise and reverse as forced sellers are exhausted.
LTH supply - cracks appearing at the edges. Long-term holders still control 78% of circulating supply (equivalent to approx. $16.3M), and broadly held through May's decline. That changed in early June: LTH-SOPR briefly fell below 1.0, meaning coins held for over 155 days were being sold at a loss, with approximately $2.4 billion realised by this cohort in 48 hours, which is a rare signal that has historically coincided with major cycle lows in 2015, 2018, and 2022.7 STH-SOPR confirms the same pattern from the shorter-tenure cohort. When both are below 1.0 simultaneously, the market is in broad capitulation.8 The question is whether this is the exhaustion point or an early stage of deeper distribution.
BTC dominance - contraction, not rotation. Dominance closed May at 59.3%, broadly flat versus April, then dipped toward 57% in early June before recovering to ~58%.9 The May reading confirms contraction rather than rotation: altcoins falling faster than BTC, capital leaving crypto rather than repositioning within it. The early June dip toward 57% should not be over-read: during a sharp BTC sell-off, altcoins can briefly hold relative value without genuine rotation occurring. Sustained dominance below 55% with altcoin price appreciation would be the signal.
Fear & Greed Index - 28 Fear. The round trip from Neutral on May 6 to Fear at month-end was the signature of a failed breakout. The move to Extreme Fear in early June reflects the floor break and liquidation cascade. At 12, the index is in territory that has historically preceded accumulation windows, though it has also persisted for weeks in bear markets. The more telling observation is the divergence: sentiment has collapsed to levels associated with major lows, yet price has not revisited the February 2026 trough. That gap cuts both ways: fear running ahead of price is either a bottoming signal or a warning that price has further to fall.

Composite sentiment index aggregating volatility, market momentum, social media activity, BTC dominance, and Google Trends. Scale: 0 = Extreme Fear, 100 = Extreme Greed. Current: 28 (Fear). Monthly average: 34.4. Source: Alternative.me
STH realized price - overhead resistance, not support. Recent buyers acquired BTC at an average of ~$77,000. At $62,000, that cohort is sitting on a ~20% unrealised loss, actively selling at a loss per the STH-SOPR. Their cost basis is now resistance. BTC must reclaim ~$77,000 before this cohort stops being a source of supply.
ETF outflows - record outflows, structural base intact. U.S. spot Bitcoin ETFs recorded 13 consecutive days of net outflows from May 15 to June 3, the longest streak since launch, shedding $4.33 billion and 59,351 BTC, a sharp reversal from April's $1.97 billion inflow month. BlackRock's IBIT accounted for $3.3 billion of the withdrawals, with total ETF assets falling from $104 billion to $83 billion across the streak. Despite the scale of the exit, cumulative lifetime net inflows since January 2024 still exceed $55 billion, a $4 billion outflow against that base is a momentum reversal, not a structural collapse. The streak ended on June 4 with a nominal $3.05 million net inflow.
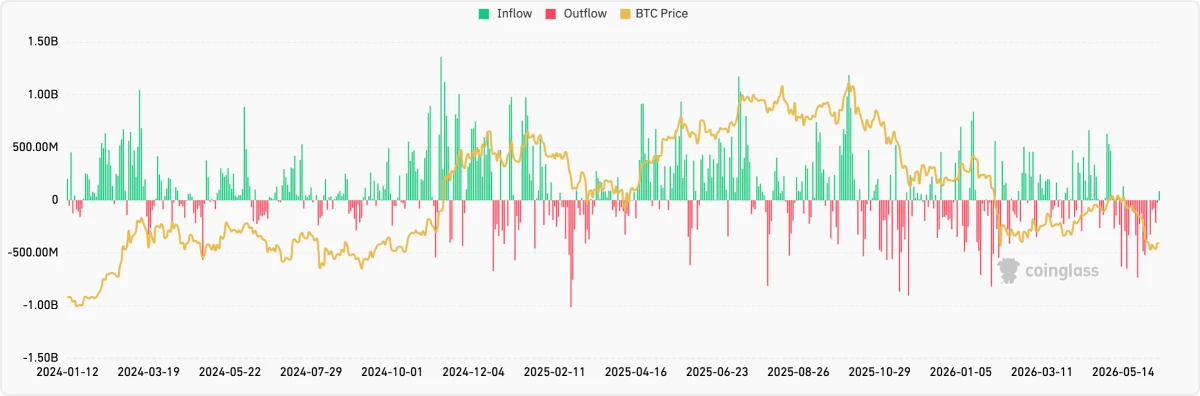
Source: Coinglass
The on-chain picture through most of May was constructive. By month-end it had fractured, and early June confirmed why: this was capitulation, not structural breakdown. MVRV falling from 0.7 to 0.34, LTH-SOPR briefly below 1.0, STH-SOPR confirming the same, and Fear & Greed at 12 are not the readings of a market in organised distribution. They are the readings of a market where forced sellers, leveraged longs, short-term holders underwater at $77,000, and a cohort of long-term holders who bought above $90,000, hit the exit simultaneously into a demand vacuum that the macro backdrop did nothing to fill. Real yields closing May near 2.07% and rising, a Fed chair yet to act, and BTC still classified as a risk asset at +0.57 Nasdaq correlation meant institutional allocators had no macro reason to step in when the floor broke. Exchange reserves edging up to 2.48M and ETF outflows reaching a record $4.33 billion over 13 sessions confirm the demand side was not there to absorb it.
The structural base, however, has not broken. LTH supply at 16.3M is broadly intact, lifetime ETF inflows still exceed $55 billion, and MVRV is approaching the green zone rather than breaking through it to the downside, and with Global M2 growing at over 10% year-on-year, the historical one-to-two month lag points to a potential demand recovery in Q3. The most telling signal is the divergence between sentiment and price: Fear & Greed at 12 without BTC revisiting the February lows suggests fear is running ahead of price, historically a bottoming condition. The floor has not been confirmed. The conditions for one are increasingly visible.
Regime: Structurally intact, tactically broken, but capitulation signals are accumulating.
May started as a month about a ceiling. It ended as a month about a floor; and then that floor broke too. BTC peaked at $82,400, was rejected at the 200-day SMA, and closed May near $73,000 before falling further toward $60,000 in early June. The break came under the weight of three events landing in the same 48-hour window: a record 13-session ETF outflow streak that had already removed the demand cushion, Strategy's first BTC sale in months, and a large Mt. Gox wallet transfer. The confluence was enough to trigger a liquidation cascade.
Top conviction signal: The floor break was sentiment-driven, not structural.
Strategy's 32 BTC sale against an 843,706 BTC treasury was operationally insignificant, executed to fund preferred dividends and followed by share repurchases. Its impact was psychological: the market had priced Strategy's bid as unconditional, and the sale broke that assumption. The Mt. Gox transfer moved coins between wallets; the estate's remaining 24,081 BTC has not been fully distributed and no corresponding market sell was recorded. Against the $55 billion accumulated since launch, the ETF outflows indicate a momentum reversal, not a structural unwind. None of the three events altered the underlying supply-demand thesis. What changed was positioning and sentiment. The structural case for BTC remained intact throughout.
What would change our view:
- MVRV breaks below zero → structural capitulation, not just correction; changes the downside risk profile materially
- LTH supply begins a sustained weekly decline → the conviction base is selling; the thesis breaks
- ETF outflow streak reverses with sustained weekly inflows → demand floor re-establishing; recovery attempt becomes credible
- Warsh delivers a clear dovish signal at June FOMC → macro ceiling lifts; second 200-day SMA attempt becomes viable
- Strategy discloses meaningful further BTC sales in its next 8-K → what was operational is becoming structural selling pressure
Watching in June:
- $60,000 - the immediate support zone; a weekly close below here puts the March 2026 low of ~$59,000 in scope
- June FOMC (June 17–18) - Warsh's first meeting; the single most important macro event of the month and the most plausible catalyst for a demand recovery
- MVRV trajectory - whether it continues toward zero or stabilises above the green zone is the clearest real-time signal of whether this is late-cycle correction or something deeper
- ETF flows - the 13-session outflow streak needs to end and reverse before any recovery attempt builds conviction
- Mt. Gox estate - 24,081 BTC remaining; any further exchange deposits are the on-chain supply signal to watch
- 200-day SMA - still the level that reclassifies everything; nothing changes structurally until BTC closes above it on a weekly basis
Collapse
The full breakdown
In our first article, "Navigating Crypto Volatility: The Advantages of Active Management," we explored how the high volatility and low correlation of digital assets with traditional asset classes create unique opportunities for active managers. We discussed how these characteristics enable active managers to execute tactical trading strategies, capitalizing on short-term price movements and market inefficiencies. Building on that foundation, we now turn our attention to the unique market microstructure of digital assets.
Conducive market microstructure of digital assets
The market microstructure of digital assets - a framework that defines how crypto trades are conducted, including order execution, price formation, and market interactions - sets the stage for active management to thrive. This unique ecosystem, characterized by its continuous trading hours, diverse trading venues, and substantial market liquidity, offers several advantages for active management, providing a fertile ground for sophisticated investment strategies.
24/7/365 market access
One of the defining characteristics of digital asset markets is their continuous, round-the-clock operation.
Unlike traditional financial markets that operate within specific hours, cryptocurrency markets are open 24 hours a day, seven days a week, all year round. This continuous trading capability is particularly advantageous for active managers for several reasons:
- Immediate response to market events: Unlike traditional markets that close after regular trading hours, digital asset markets allow managers to react immediately to breaking news or events that could impact asset prices. For instance, if a significant economic policy change occurs over the weekend, managers can adjust their positions in real-time without waiting for markets to open.
- Managing volatility: Continuous trading provides more opportunities to capitalize on price movements and volatility. Active managers can take advantage of this by implementing strategies such as short-term trading or hedging to mitigate risks and lock in gains whenever market conditions change. For instance, if there’s a sudden drop in the price of Bitcoin, managers can quickly sell their holdings to minimize losses or buy in to capitalize on the lower prices.
Variety of trading venues
The proliferation and variety of trading venues is another crucial element of the digital asset market structure. The extensive landscape of over 200 centralized exchanges (CEX) and more than 500 decentralized exchanges (DEX) offers a wide array of platforms for cryptocurrency trading. This diversity is beneficial for active managers in several ways:
- Risk management and diversification: By spreading trades across various exchanges, active managers can mitigate counterparty risk associated with any single platform. Additionally, the ability to trade on both CEX and DEX platforms allows managers to diversify their strategies, incorporating different levels of decentralization, regulatory environments, and security features.
- Arbitrage opportunities: Different venues often exhibit price discrepancies, presenting arbitrage opportunities. For example, managers can buy an asset on one exchange at a lower price and sell it on another where the price is higher, thus generating risk-free profits.
- Access to diverse liquidity pools: Multiple trading venues provide access to diverse liquidity pools, ensuring that managers can execute large trades without significantly impacting the market price.
Spot and derivatives markets (Variety of instruments)
The seamless integration of spot and derivatives markets within the digital asset space presents a considerable advantage for active managers. With substantial liquidity in both markets, they can implement sophisticated trading strategies and manage risk more effectively.
For instance, as of August 8 2024, Bitcoin (BTC) boasts a daily spot trading volume of $40.44 billion and an open interest in futures of $27.75 billion. Additionally, derivatives such as futures, options, and perpetual contracts enable managers to hedge positions, leverage trades, and employ complex strategies that can amplify returns.

Overall, the benefits for active managers include:
- Hedging and risk management: Derivatives offer a powerful tool for hedging against unfavorable price movements, enabling more efficient risk management. For instance, a manager holding a substantial amount of Bitcoin in the spot market can use Bitcoin futures contracts to safeguard against potential price drops, thereby enhancing risk control.
- Access to leverage: Managers can use derivatives to leverage their positions, amplifying potential returns while maintaining control over risk exposure. For instance, by employing options, a manager can gain exposure to an underlying asset with only a fraction of the capital needed for a direct spot purchase, thereby enabling more capital-efficient investment strategies.
- Strategic flexibility: By integrating spot and derivatives markets, managers can implement sophisticated strategies designed to capitalize on diverse market conditions. For instance, they may engage in volatility selling, where options are sold to generate income from market volatility, regardless of price direction. Additionally, managers can leverage favorable funding rates in perpetual futures markets to enhance yield generation. Basis trading, another strategy, involves taking offsetting positions in spot and futures markets to profit from price differentials, enabling returns that are independent of market movements.
Exploiting market inefficiencies
Digital asset markets, being relatively nascent, are less efficient compared to traditional financial markets. These inefficiencies arise from various factors, including regulatory differences, market segmentation, and varying levels of market maturity. For example:
- Pricing anomalies: Phenomena like the "Kimchi premium," where cryptocurrency prices in South Korea trade at a premium compared to other markets, create arbitrage opportunities. Managers can exploit these by buying assets in one market and selling them in another at a higher price.
- Exploiting mispricings: Active managers can identify and capitalize on mispricings caused by market inefficiencies, using strategies such as statistical arbitrage and mean reversion.
The unique aspects of the digital asset market structure create an exceptionally conducive environment for active management. Continuous trading hours and diverse venues provide the flexibility to react quickly to market changes, ensuring timely execution of trades. The availability of both spot and derivatives markets supports a wide range of sophisticated trading strategies, from hedging to leveraging positions. Market inefficiencies and pricing anomalies offer numerous opportunities for generating alpha, making active management particularly effective in the digital asset space. Furthermore, the ability to hedge and manage risk through derivatives, along with exploiting uncorrelated performance, enhances portfolio resilience and stability.
In our next article, we'll delve into the various techniques active managers employ in the digital asset markets, showcasing real-world use cases.
Read full disclaimer
1) Coindesk 2) The Block 3) Fred 4) CNBC 5) CNBC 6) CFBenchmarks 7) Yahoo Finance 8) Glassnode 9) Coinglass 10) Glassnode: Bitcoin STH-SOPR 11) Galaxy