
The floor nobody bought | AI generated image by XBTO

Bitcoin rose 7.27% in July, a month in which investors demanded the highest real yield at a U.S. 10-year TIPS auction since 2008, three Federal Reserve officials voted to raise rates, and the AI trade that has carried equities for two years unwound sharply. It did so while US spot Bitcoin ETFs recorded the smallest positive flow month of the year. The rally had little evidence of a new structural buyer behind it. That gap between price and flow is what this issue examines.
The month in brief
July was a month of dispersion rather than a broad risk rally. Bitcoin gained 7.27% and Ether 18.49%, but Solana fell 1.09% and XRP added just 2.10%, so the strength was selective rather than a lift in crypto beta. On the traditional side, oil rose 21.35% while the Nasdaq Composite fell 3.20% and the S&P 500 finished effectively flat at -0.13%. Gold managed 0.86% and the dollar index fell 1.37%. Energy and two large-cap digital assets carried the month. Almost nothing else did.
Monthly asset returns - July 2026 (%)
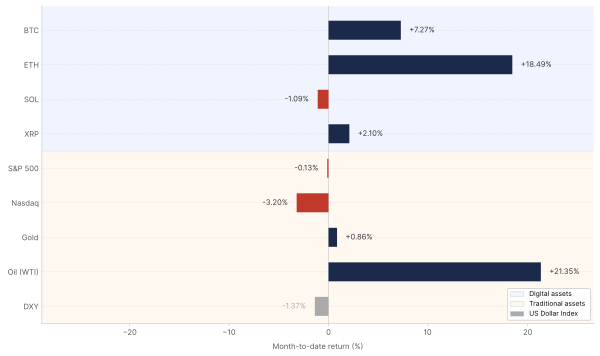
Month-to-date returns for selected crypto and traditional assets as of 31 July 2026. Crypto sourced from Binance (USDT pairs, monthly close). Traditional assets from Yahoo Finance (monthly close, price return only); oil proxied by USO ETF.
The equity weakness was concentrated where risk appetite is most expressed, and that concentration is the detail that matters. Chip stocks fell more than 20% from their June record, into bear-market territory, as investors turned on hyperscaler capital spending, taking more than a trillion dollars of semiconductor market value with them.1 The rotation was as sharp as the selloff: a UBS basket of AI-spending winners ended the month trailing a basket of stocks most exposed to AI disruption by 42 percentage points, a record gap.2 Beneath the flat headline index, energy gained 12.6% and financials 5.6%, against information technology at -2.0% and industrials at -2.7%.3 This wasn't a selloff. It was a rotation out of the market's most crowded trade.
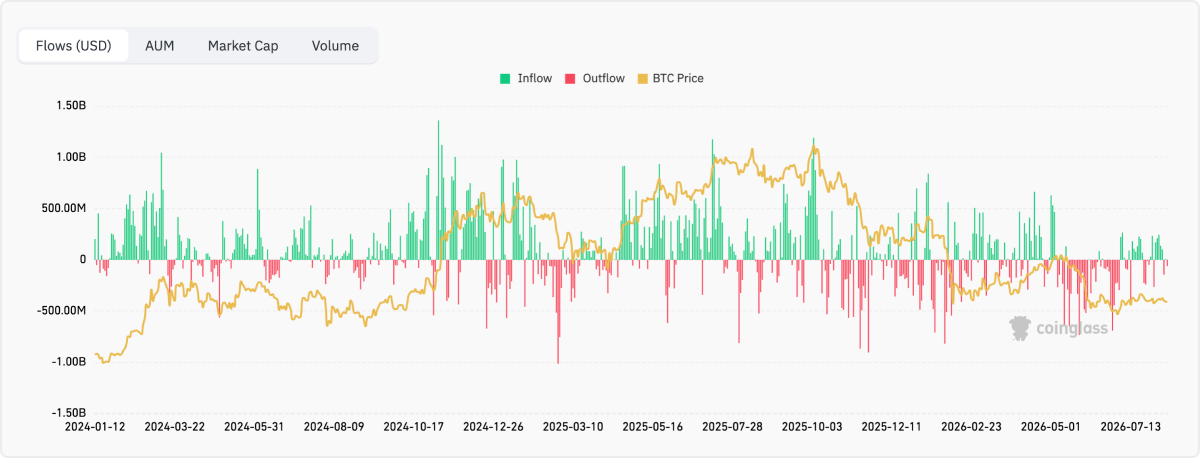
The institutional data tells the same story inside crypto. US spot Bitcoin ETFs took in $172.4 million, ending two months of redemptions but landing as the weakest monthly inflow of 2026, with the products still roughly $5.3 billion in net outflows year to date.4 Ether ETFs took $365.2 million across four consecutive positive weeks, more than twice the Bitcoin figure from a materially smaller base. Capital came back to crypto in July. It didn't come back to Bitcoin, and working out why is what this issue is built around.
Bitcoin's July gain arrived in the least supportive macro environment of the year. Real yields returned to levels last seen in October 2023 and, prior to that, not since 2008, the Fed's dissenting bloc argued for tightening rather than easing, and growth deteriorated without buying any prospect of relief.
Understanding what actually moved Bitcoin, and what only appeared to, starts with separating the month's price action from the month's sequence. Three signals tell that story:
1. Crypto and equities diverged on the month
The monthly numbers make July look like a decoupling. Bitcoin rose 7.27% while the Nasdaq fell 3.20%, an eleven-point spread. The daily path complicates that.
Bitcoin's gain was made early and from a very low base. It entered the month at a 21-month low near $58,000 after June's 20% decline and a record ETF outflow month, then rallied more than 13% over the following three weeks, trading as high as $66,300 on the back of a seven-session ETF inflow streak that pulled in close to $1 billion, the longest and largest of 2026. That was a market recovering its own losses on its own flows, and it was largely complete by 23 July.
The final week is where both assets were tested at once. The inflow streak broke on 24 July with $225.2 million of redemptions as Bitcoin slipped below $65,000 alongside falling US stocks on renewed US-Iran tension. Through the closing days, with the semiconductor selloff at its most acute and the Fed offering nothing, Bitcoin fell 3.78% into 28 July and dropped roughly 3% again on the final day, closing near $63,900 with $265.4 million leaving the ETFs, the largest single-day outflow since 13 July.
BTC vs Nasdaq 100: 12-month rolling correlation (monthly data, since 2015)
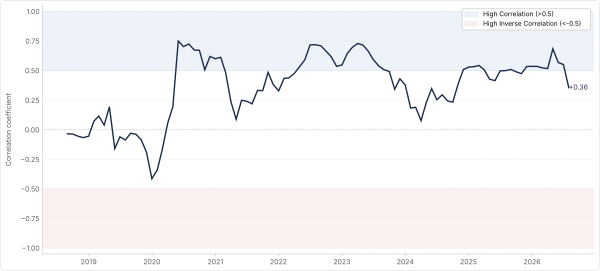
12-month rolling Pearson correlation between BTC monthly returns and Nasdaq 100 monthly returns. A correlation above 0.5 indicates BTC is trading with high-beta tech characteristics. A sustained move below 0.5 supports the thesis that BTC is maturing as a distinct asset class. Current reading: +0.36 (July 2026). Source: Binance (BTC/USDT monthly close), Yahoo Finance (^NDX monthly close)
The 12-month rolling correlation between BTC and the Nasdaq 100 fell to +0.36 from +0.55, the lowest reading since late 2024 and the first move below the 0.5 threshold in this cycle. Readings above that level place Bitcoin firmly in high-beta technology territory, which is where it has spent almost all of the period since spot ETFs launched. Its significance depends entirely on whether it persists.
Bitcoin began July having already taken its damage, with leverage cleared and the marginal seller exhausted, which gave it room to recover that equities didn't have. Equities began July at the top of a two-year run in the market's most crowded trade, which gave them room to fall that Bitcoin didn't have. The same macro backdrop landed on two assets in opposite positions and produced opposite results, and that is a positioning outcome rather than a decoupling. A genuine reclassification would show Bitcoin holding while equities fall in the same week. July's final week is the one clean test of that in the data, and Bitcoin failed it.
2. Real yields at their highest since 2008
The 10-year real yield closed July at 2.47%, a level last reached in October 2023 and before that not seen since 2008, with the 10-year nominal Treasury up 33 basis points to 4.74%.5 A real yield at that level means an investor can lock in inflation-adjusted return with no credit risk, and every non-yielding asset has to clear that hurdle on price appreciation alone. Bitcoin did.
BTC vs 10Y real yields: 12-month rolling correlation
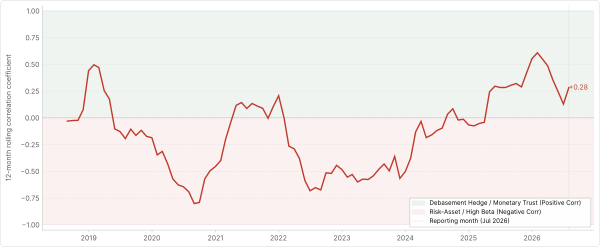
12-month rolling Pearson correlation between BTC monthly returns and monthly changes in the 10Y TIPS real yield (FRED: DFII10). Positive zone = BTC behaving as a debasement hedge. Negative zone = BTC behaving as a rate-sensitive risk asset. Current reading: +0.28 (Jul 2026).
The 12-month rolling correlation to real yield changes rose to +0.28 from +0.13, reversing a slide through the prior two months that had looked like Bitcoin reasserting its conventional, pre-2024 sensitivity to rates. Positive readings suggest that Bitcoin is exhibiting greater resilience to rising real yields, rather than being consistently suppressed by them. What makes this reading more useful than the Nasdaq one is that it was tested directly: real yields rose throughout the month, culminating in the July 10-year TIPS auction clearing at its highest real yield since 2008, and Bitcoin rose with them. That's harder to explain away as a timing artefact, and it's where our conviction sits this month.
The Fed supplied the cause, and the vote mattered more than the decision. The Committee held at 3.50% to 3.75% on 29 July, but three members, all regional presidents, dissented in favour of a 25 basis point increase.6 That's an active bloc arguing to tighten into a market that began the year pricing cuts, with September now the first live meeting. Warsh declined to characterise the hold as a pause, framing it as a review of unresolved questions and describing the decision as the beginning of a story rather than the end of one. The statement was near-identical to June's and offered neither guidance nor conditions. For risk assets, hawkish dissent combined with deliberate ambiguity is a harder ceiling than an explicit hiking path, because it removes the ability to price a timeline at all.
3. Growth slowing into a fresh energy impulse
The second-quarter data marks the first genuine deterioration in US growth this year, and it arrives at the worst possible moment for anyone hoping the Fed provides relief. GDP rose 1.5% after 2.1% in the first quarter, and June payrolls came in at 57,000 against estimates of 113,000, since revised down to 20,000. Consumer prices fell 0.4% on the month, the largest decline since April 2020, but still ran 3.5% year over year with core PCE at 3.3%.
The energy picture is what stops this reading as clean disinflation. June's soft print was largely an energy effect, and oil rose 21.35% over July on renewed Middle East disruption, which began reversing it. Import prices were up 7.1% over twelve months, the largest increase since August 2022. The disinflation is arriving in the rear-view mirror while the impulse builds ahead of it.
That leaves the Committee without a comfortable option and Bitcoin without a plausible path to policy relief. Weak growth alone would argue for cuts. Sticky inflation alone would argue for holding. Both together mean the data has to break decisively in one direction before the Fed can move at all, and an energy shock feeding the inflation side makes that resolution slower rather than faster. Nothing in July's macro data made an easing more likely, and Bitcoin's gain happened despite that rather than in anticipation of it.
The on-chain data answers the question the price action raises. If the macro backdrop was hostile and the ETF bid was the weakest of the year, who was buying? On the evidence below, almost nobody. Here's what the data shows at month-end:
Leverage - the flush happened in June, and it’s the mechanical explanation for July. Bitfinex noted that crypto entered the July FOMC carrying far less leverage than equities after positioning was cleared in the selloff that took Bitcoin below $58,000 on 1 July, with daily liquidations since holding well below this year's typical $400 million to $500 million range.7 A market with no leveraged sellers left falls less when it's shocked, and that's probably the largest single contributor to July's outperformance.
Realised losses, 30-day - a record, and it cuts both ways. Buyers who entered between $75,000 and $126,000 over the past six to eighteen months are now selling at a loss. On a 30-day average, this cohort holds 2,450 BTC at a loss on exchanges, with realised losses at a record monthly average near $90 million.8 Analysts read it as a bear market well advanced; the opposing view treats record losses as late-stage exhaustion. What it settles is that July's selling wasn't absent, it had changed hands. Leveraged longs cleared in June. What sold in July was spot, from holders who bought near the highs.
LTH supply - rose on the month, but distributed into the rally. Long-term holder supply closed July at 16.77 million BTC, up from 16.63 million, having peaked at 16.84 million before giving back roughly 70,000 BTC in the second half.9 The gain is less than half June's pace, and the shape matters more than the total: supply aged into the cohort through the early recovery, then moved as price approached $67,000. That's long-term holders selling into strength, the same behaviour the realised loss data captures from the other side.
LTH-SOPR and STH-SOPR - both cohorts finished at breakeven. LTH-SOPR closed July at 1.0 after oscillating between 0.7 and 1.2, and STH-SOPR also finished at 1.0.10 Readings at 1.0 mean the average coin changes hands at neither profit nor loss, the signature of a market trading at its own cost basis. Both cohorts converging there improves on the prior month, but a flat SOPR describes stalemate rather than accumulation.
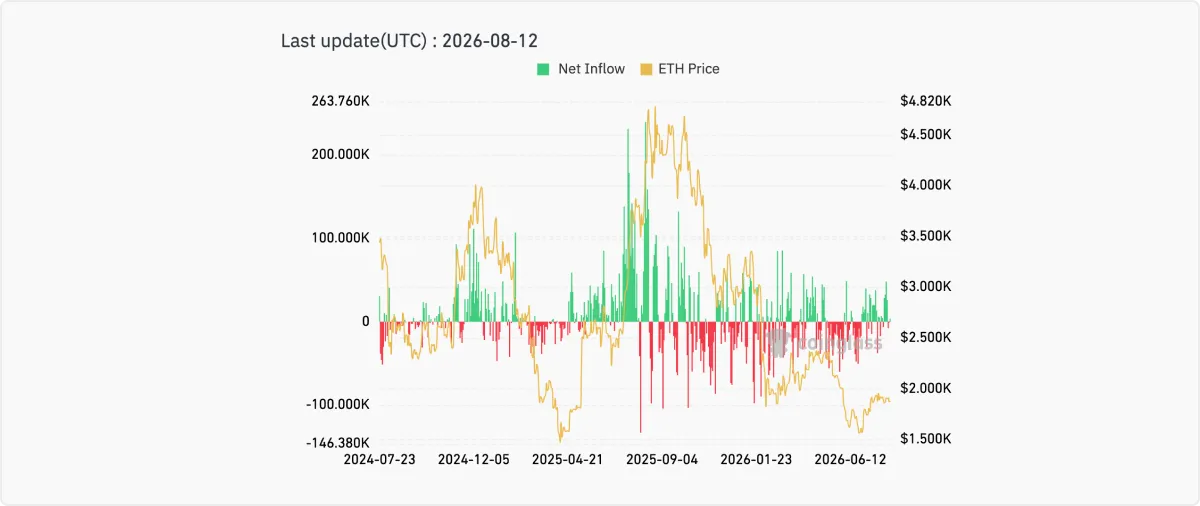
ETF flows - positive on Bitcoin, decisively better on Ether, and the reason is yield. July's $172.4 million was the weakest monthly inflow of 2026, against $365.2 million into Ether products across four consecutive positive weeks.11 The difference between the two products is that one pays. BlackRock's staked Ethereum ETF distributes 82% of gross staking rewards to shareholders, retaining 18% as a staking fee, which makes Ether a yield-bearing position inside a regulated wrapper. Bitcoin has no native equivalent. With the real yield at 2.47%, an asset paying nothing has to justify itself entirely on appreciation, and July was a month when allocators appeared unwilling to make that trade.
Spot Bitcoin ETF Net Inflow (USD billions), Jan 2024-July 2026
Source: Coinglass
Total Ethereum Spot ETF Net Inflow (USD) , July 2024-July 2026
Source: Coinglass
Stablecoin reserves - dry powder leaving the exchanges. Roughly $2.3 billion in stablecoins left Binance and Bybit over the thirty days to late July. According to CryptoQuant, this reads as weakening liquidity and softer buying demand. Stablecoins on exchanges are the most direct measure of ready buying power, and a decline alongside a rising price is the opposite of what a demand-driven rally looks like.
BTC Dominance - Bitcoin held, Ether took the share. BTC dominance spent July between 58% and 59%, broadly flat, while Ether dominance rose to 10.5% from 9.3% and the ETH/BTC ratio reached around 0.03.12 Flat Bitcoin dominance alongside rising Ether dominance is rotation within the asset class rather than capital leaving it, which is a change from the prior two months.
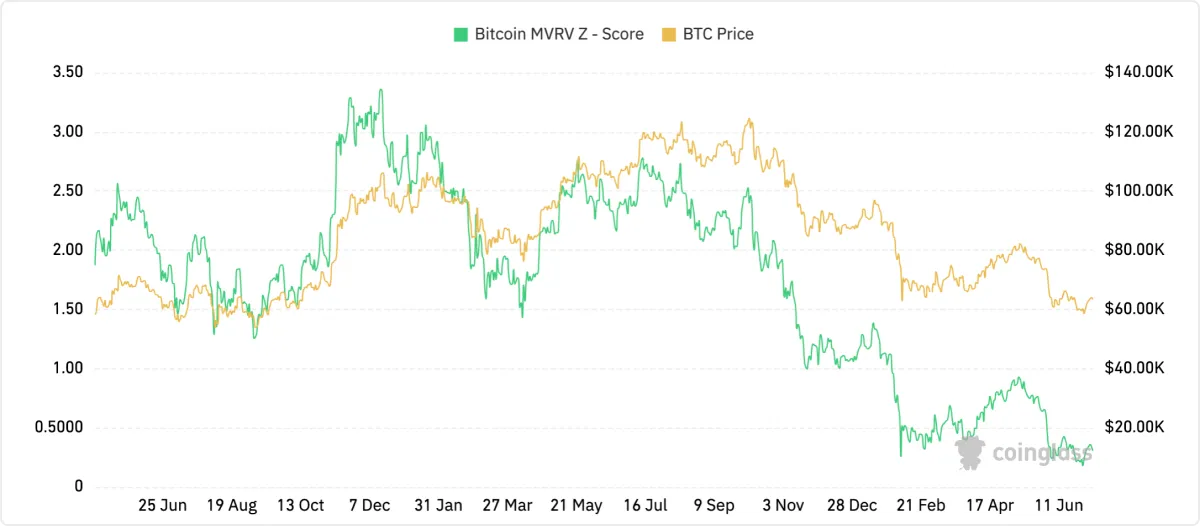
MVRV Z-Score - recovered and held. The score closed July at 0.29, up from 0.18, holding the recovery that began in early July rather than rolling back toward the low. That keeps Bitcoin in the range historically associated with accumulation, and the trajectory reads better than the level: a metric that hit a three-year low and stabilised describes a floor.
Bitcoin MVRV Z-Score vs BTC Price (USD), May 2024-June 2026
Source: Coinglass
Fear & Greed - 25, out of Extreme Fear. The index finished July at 25 against 15 at the prior month-end, moving from Extreme Fear into Fear as price recovered. Sentiment and price moved together again, the ordinary pattern, which argues against treating the level as contrarian in either direction.
Crypto Fear & Greed Index: trailing 12 months (daily)
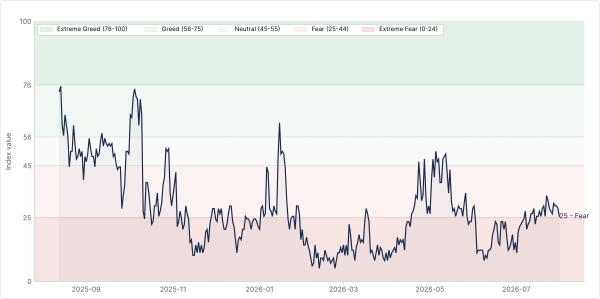
Composite sentiment index aggregating volatility, market momentum, social media activity, BTC dominance, and Google Trends. Scale: 0 = Extreme Fear, 100 = Extreme Greed. Current: 25 (Fear). Monthly average: 25.3. Source: Alternative.me.
The signal cutting the other way - Bitcoin's largest holder now sells on a schedule. Strategy sold 1,638 BTC for roughly $104.7 million between 27 July and 2 August at an average $63,957, against a cost basis of $75,419. The company disclosed the proceeds as funding preferred-stock distributions and replenishing its dollar reserve. Everything else in the second-quarter results points the other way: holdings up 11% over the quarter to approximately 846,000 BTC, convertible debt down 18% to $6.7 billion, and the dollar reserve up 12% to $2.4 billion. This isn't distress. But a treasury selling below cost to meet a fixed dollar obligation supplies the market differently than one selling when it chooses to.
The macro side offered no support. Real yields closed the month at 2.47%, a level last seen in 2023, the Fed's dissenting bloc argued for hikes rather than cuts, and growth deteriorated without producing any prospect of near-term easing. Bitcoin's factor loadings nonetheless moved away from high-beta technology on both measures, and the real yield reading is the one that stands up, because it was tested directly rather than produced by a difference in timing.
On-chain, every measure of the bid is weak and several measures of supply are not. The ETF inflow was the smallest of the year while Ether took more than twice the dollars into a yield-bearing wrapper. Stablecoin balances on exchanges fell by $2.3 billion, so ready buying power was leaving rather than accumulating. Realised losses among recent top buyers hit a record, long-term holders distributed roughly 70,000 BTC as price approached $67,000, and Strategy sold below its own cost basis to fund a dividend. What held the price up was not that buyers arrived. It was that June had already removed the leveraged sellers, leaving a thin float and a tape that couldn't be pushed decisively either way.
That produces a genuinely two-sided position. MVRV holding near its cost basis, SOPR at breakeven and leverage subdued are the conditions under which floors form, and they are real. But a floor formed by absence rather than by demand is a fragile one, and the supply that will test it is identifiable and dated rather than hypothetical. The question for the coming months is a flow question, not a price question.
Regime: Stabilised, not repaired.
Bitcoin traded through the year's least supportive macro conditions without forced selling, and both its factor loadings moved away from the high-beta classification that has defined it since 2024. But the month's gain came from cleared positioning rather than returning capital, and every independent measure of the bid, from ETF flows to stablecoin balances to the behaviour of long-term holders, points the same way. A market that has stopped falling isn't the same as one that has turned.
Top conviction signal: the real yield correlation
The 12-month rolling correlation to real yield changes rose to +0.28 from +0.13 in a month when the ten-year real yield cleared at auction above 2.4% and three Committee members voted to tighten. Real yields rose and Bitcoin rose with them, which is debasement-hedge behaviour under demanding conditions. The Nasdaq correlation fell further, to +0.36 from +0.55, but that reading is undercut by sequence: Bitcoin's gain was made in the first three weeks, and when both assets were tested in the same week at month-end they fell together.
What would change our view:
- The real yield correlation reverting toward zero, which would remove the one factor signal this month that survived a direct test
- ETF flows holding near their July level through September while price holds, confirming a frozen tape rather than a returning bid
- Bitcoin selling off alongside equities on the next leg of the AI unwind, which would show the Nasdaq reading reflected absent exposure to one trade rather than any change in Bitcoin's own loading
- Ether continuing to take the majority of the marginal crypto dollar, turning July's flow split into a structural preference for yield over scarcity
- Long-term holders distributing further into any move above $67,000, which would establish the July pattern as the shape of the recovery rather than a single episode
Watching in August:
- ETF flow persistence - the single most important variable, and the early read is encouraging. US spot Bitcoin ETFs took roughly $854 million in the week ending 7 August, the strongest weekly inflow since April. Whether that holds through the month is the test this issue sets.
- Jackson Hole - whether Warsh converts July's dissents into any articulation of the conditions under which the Committee would move, given his stated preference for conditions over guidance.
- The 15 to 16 September FOMC - now the first genuinely live meeting of the cycle in the tightening direction.
- Strategy's next monetisation disclosure - whether the sales settle into a monthly cadence tied to the distribution calendar rather than remaining episodic.
- The BTC/ETH flow split - whether the yield advantage continues drawing the marginal allocator, which is a structural question rather than a monthly one.
- Whether the AI unwind extends or stabilises - which determines if August delivers a second observation on the equity correlation or reverses the first.
1) Yahoo Finance 2) CNBC 3) First Financial Trust 4) Trading View 5) FRED 6) The Federal Reserve 7) CoinDesk 8) BeInCrypto 9) Coinglass 10) Coinglass 11) Trading View 12) Coinglass 13) Strategy
Collapse
The full breakdown
In our first article, "Navigating Crypto Volatility: The Advantages of Active Management," we explored how the high volatility and low correlation of digital assets with traditional asset classes create unique opportunities for active managers. We discussed how these characteristics enable active managers to execute tactical trading strategies, capitalizing on short-term price movements and market inefficiencies. Building on that foundation, we now turn our attention to the unique market microstructure of digital assets.
Conducive market microstructure of digital assets
The market microstructure of digital assets - a framework that defines how crypto trades are conducted, including order execution, price formation, and market interactions - sets the stage for active management to thrive. This unique ecosystem, characterized by its continuous trading hours, diverse trading venues, and substantial market liquidity, offers several advantages for active management, providing a fertile ground for sophisticated investment strategies.
24/7/365 market access
One of the defining characteristics of digital asset markets is their continuous, round-the-clock operation.
Unlike traditional financial markets that operate within specific hours, cryptocurrency markets are open 24 hours a day, seven days a week, all year round. This continuous trading capability is particularly advantageous for active managers for several reasons:
- Immediate response to market events: Unlike traditional markets that close after regular trading hours, digital asset markets allow managers to react immediately to breaking news or events that could impact asset prices. For instance, if a significant economic policy change occurs over the weekend, managers can adjust their positions in real-time without waiting for markets to open.
- Managing volatility: Continuous trading provides more opportunities to capitalize on price movements and volatility. Active managers can take advantage of this by implementing strategies such as short-term trading or hedging to mitigate risks and lock in gains whenever market conditions change. For instance, if there’s a sudden drop in the price of Bitcoin, managers can quickly sell their holdings to minimize losses or buy in to capitalize on the lower prices.
Variety of trading venues
The proliferation and variety of trading venues is another crucial element of the digital asset market structure. The extensive landscape of over 200 centralized exchanges (CEX) and more than 500 decentralized exchanges (DEX) offers a wide array of platforms for cryptocurrency trading. This diversity is beneficial for active managers in several ways:
- Risk management and diversification: By spreading trades across various exchanges, active managers can mitigate counterparty risk associated with any single platform. Additionally, the ability to trade on both CEX and DEX platforms allows managers to diversify their strategies, incorporating different levels of decentralization, regulatory environments, and security features.
- Arbitrage opportunities: Different venues often exhibit price discrepancies, presenting arbitrage opportunities. For example, managers can buy an asset on one exchange at a lower price and sell it on another where the price is higher, thus generating risk-free profits.
- Access to diverse liquidity pools: Multiple trading venues provide access to diverse liquidity pools, ensuring that managers can execute large trades without significantly impacting the market price.
Spot and derivatives markets (Variety of instruments)
The seamless integration of spot and derivatives markets within the digital asset space presents a considerable advantage for active managers. With substantial liquidity in both markets, they can implement sophisticated trading strategies and manage risk more effectively.
For instance, as of August 8 2024, Bitcoin (BTC) boasts a daily spot trading volume of $40.44 billion and an open interest in futures of $27.75 billion. Additionally, derivatives such as futures, options, and perpetual contracts enable managers to hedge positions, leverage trades, and employ complex strategies that can amplify returns.

Overall, the benefits for active managers include:
- Hedging and risk management: Derivatives offer a powerful tool for hedging against unfavorable price movements, enabling more efficient risk management. For instance, a manager holding a substantial amount of Bitcoin in the spot market can use Bitcoin futures contracts to safeguard against potential price drops, thereby enhancing risk control.
- Access to leverage: Managers can use derivatives to leverage their positions, amplifying potential returns while maintaining control over risk exposure. For instance, by employing options, a manager can gain exposure to an underlying asset with only a fraction of the capital needed for a direct spot purchase, thereby enabling more capital-efficient investment strategies.
- Strategic flexibility: By integrating spot and derivatives markets, managers can implement sophisticated strategies designed to capitalize on diverse market conditions. For instance, they may engage in volatility selling, where options are sold to generate income from market volatility, regardless of price direction. Additionally, managers can leverage favorable funding rates in perpetual futures markets to enhance yield generation. Basis trading, another strategy, involves taking offsetting positions in spot and futures markets to profit from price differentials, enabling returns that are independent of market movements.
Exploiting market inefficiencies
Digital asset markets, being relatively nascent, are less efficient compared to traditional financial markets. These inefficiencies arise from various factors, including regulatory differences, market segmentation, and varying levels of market maturity. For example:
- Pricing anomalies: Phenomena like the "Kimchi premium," where cryptocurrency prices in South Korea trade at a premium compared to other markets, create arbitrage opportunities. Managers can exploit these by buying assets in one market and selling them in another at a higher price.
- Exploiting mispricings: Active managers can identify and capitalize on mispricings caused by market inefficiencies, using strategies such as statistical arbitrage and mean reversion.
The unique aspects of the digital asset market structure create an exceptionally conducive environment for active management. Continuous trading hours and diverse venues provide the flexibility to react quickly to market changes, ensuring timely execution of trades. The availability of both spot and derivatives markets supports a wide range of sophisticated trading strategies, from hedging to leveraging positions. Market inefficiencies and pricing anomalies offer numerous opportunities for generating alpha, making active management particularly effective in the digital asset space. Furthermore, the ability to hedge and manage risk through derivatives, along with exploiting uncorrelated performance, enhances portfolio resilience and stability.
In our next article, we'll delve into the various techniques active managers employ in the digital asset markets, showcasing real-world use cases.
Read full disclaimer